Maps — commissions & the News Atlas John Kenny · Chicago
For civic, scientific & educational work

The map your
story deserves

A good map shows in five seconds what a report takes pages to explain. I make maps for nonprofits and for civic, scientific and educational work, built to the standard of a printed atlas and delivered ready to print.

  • Print-ready PDF
  • Every figure sourced
  • Fixed price per map
  • Editable source files
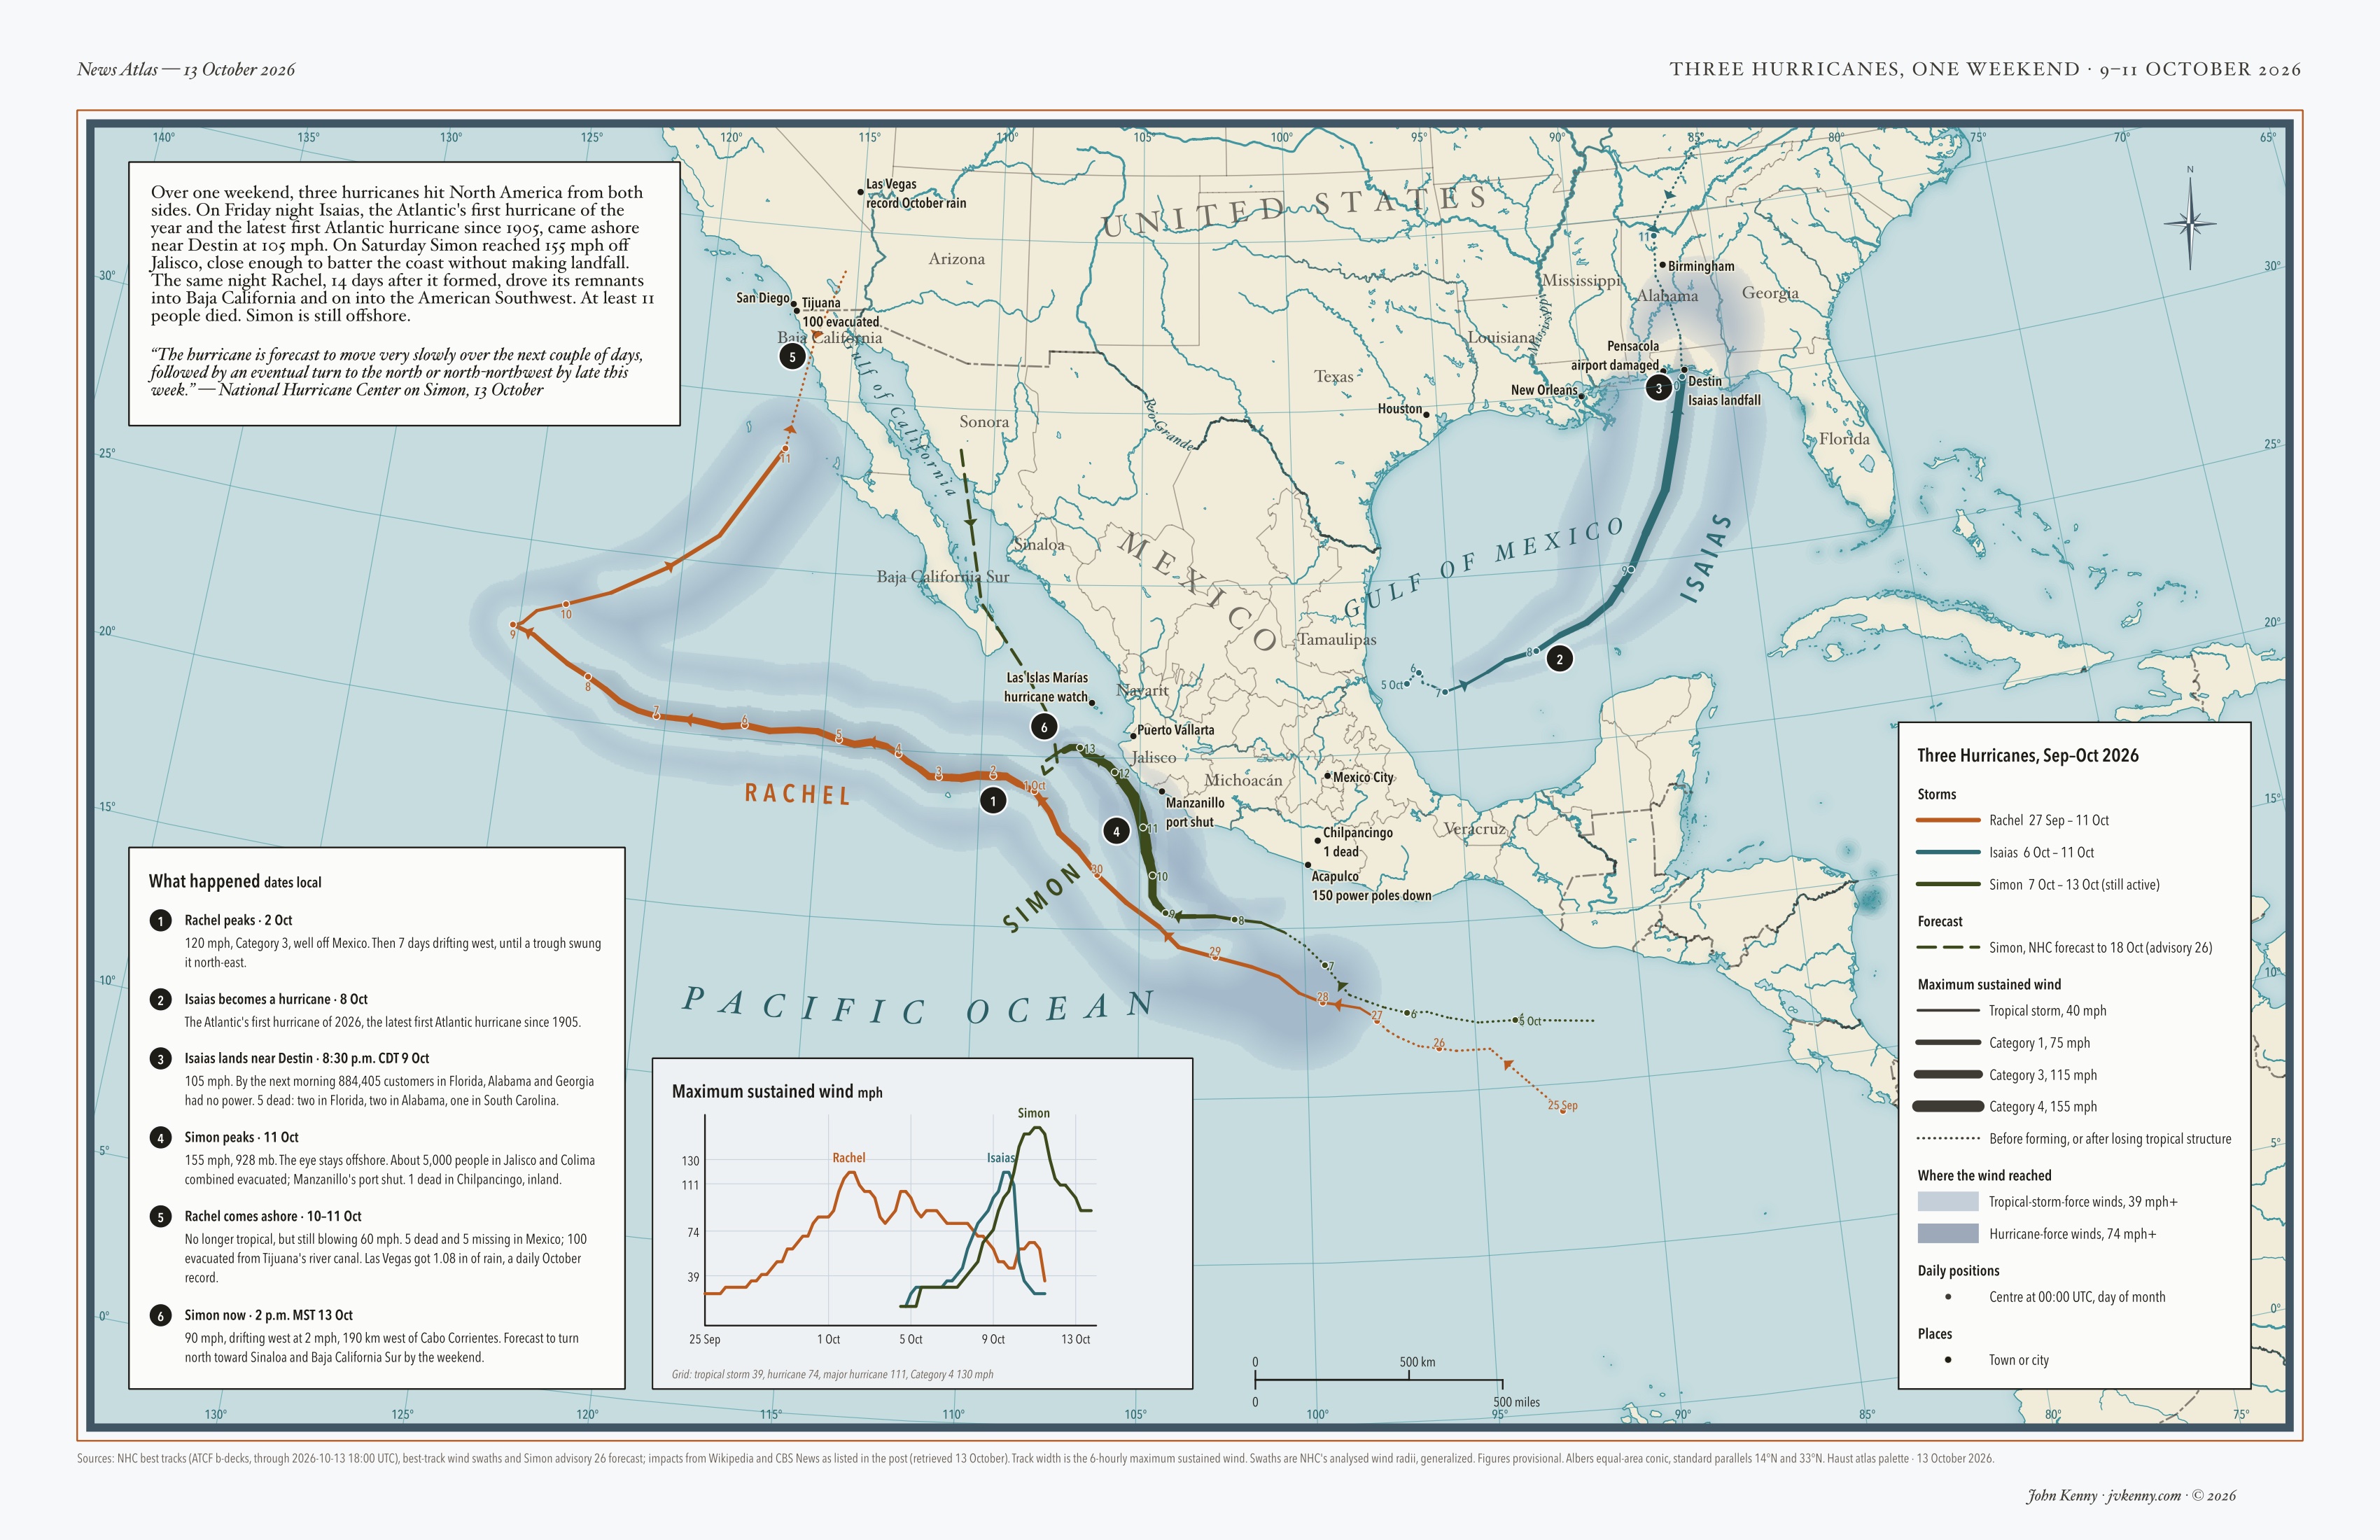
Map of Mexico, the southern United States and the eastern Pacific. Three hurricane tracks, each thicker where its winds were stronger: Isaias in teal runs north through the Gulf to the Florida Panhandle; Simon in dark green runs up Mexico's Pacific coast and becomes a dashed forecast line; Rachel in orange loops far out into the Pacific and doubles back into Baja California near Tijuana. Soft blue bands show how far the strong winds reached. A chart compares the three storms' wind speeds, and numbered notes give dates, deaths and power outages.
News Atlas · Three Hurricanes, One Weekend North America, 9–11 October 2026 · 11 × 17 in
Contents

The maps


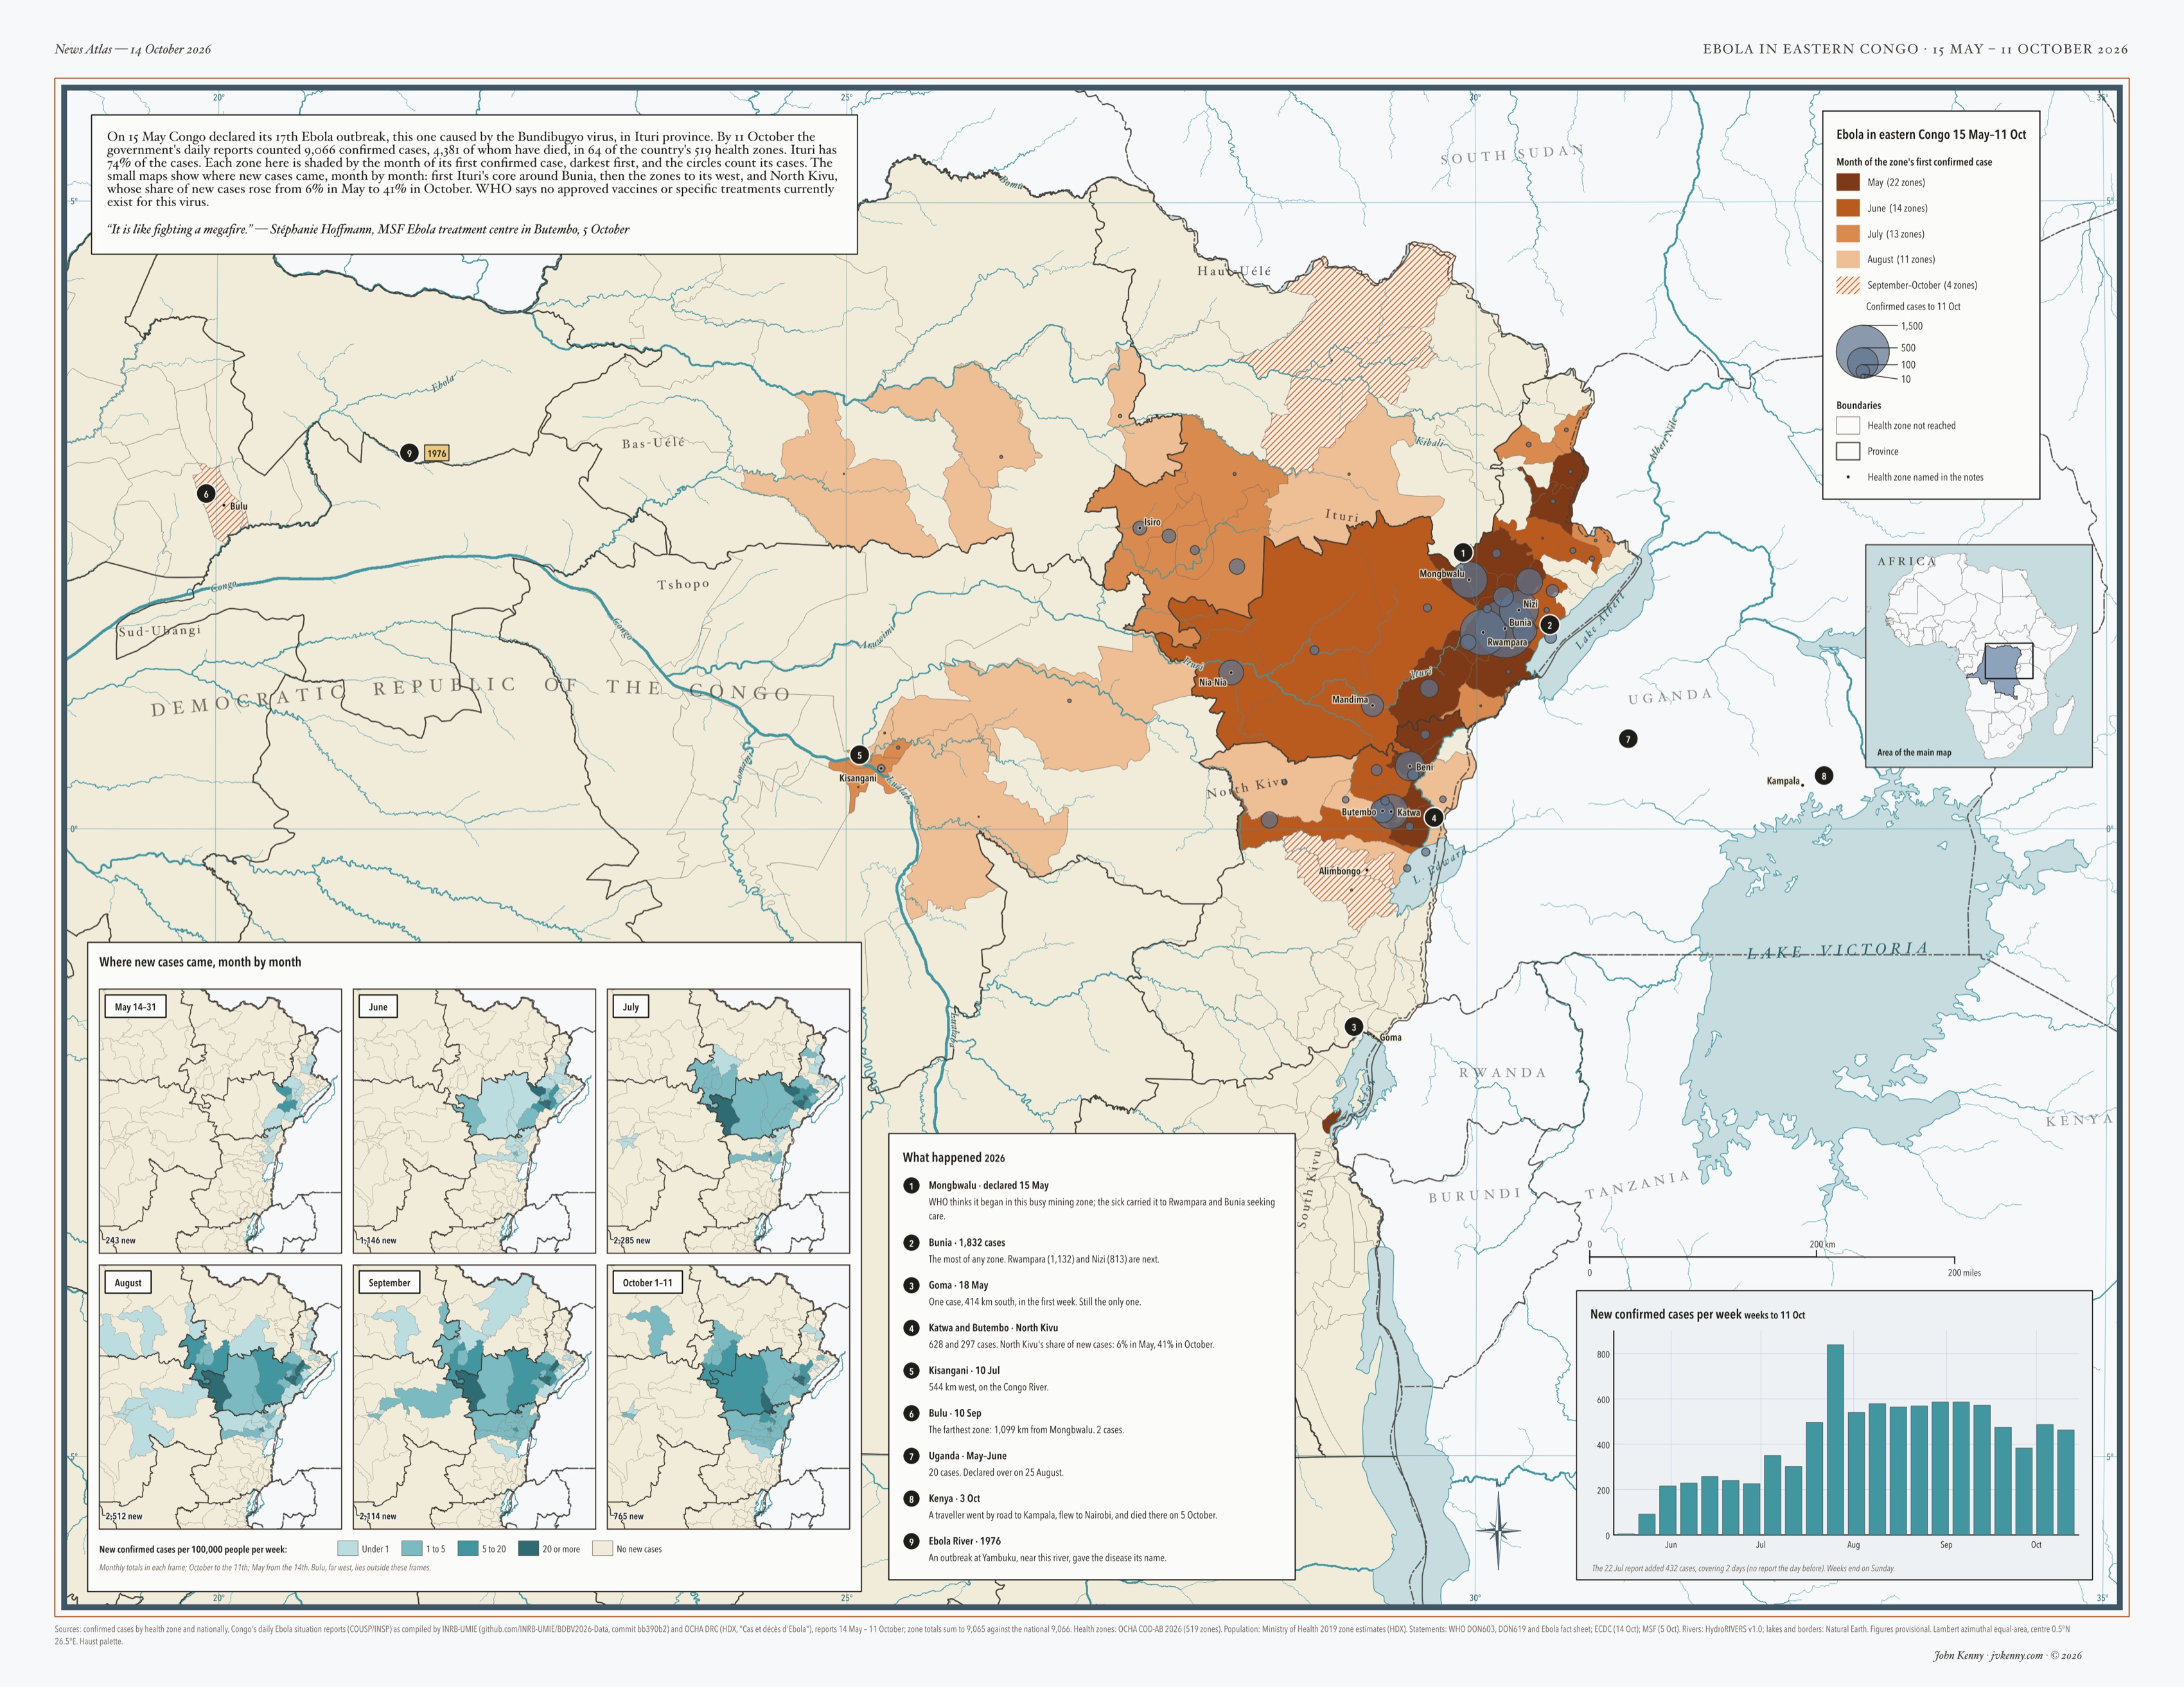
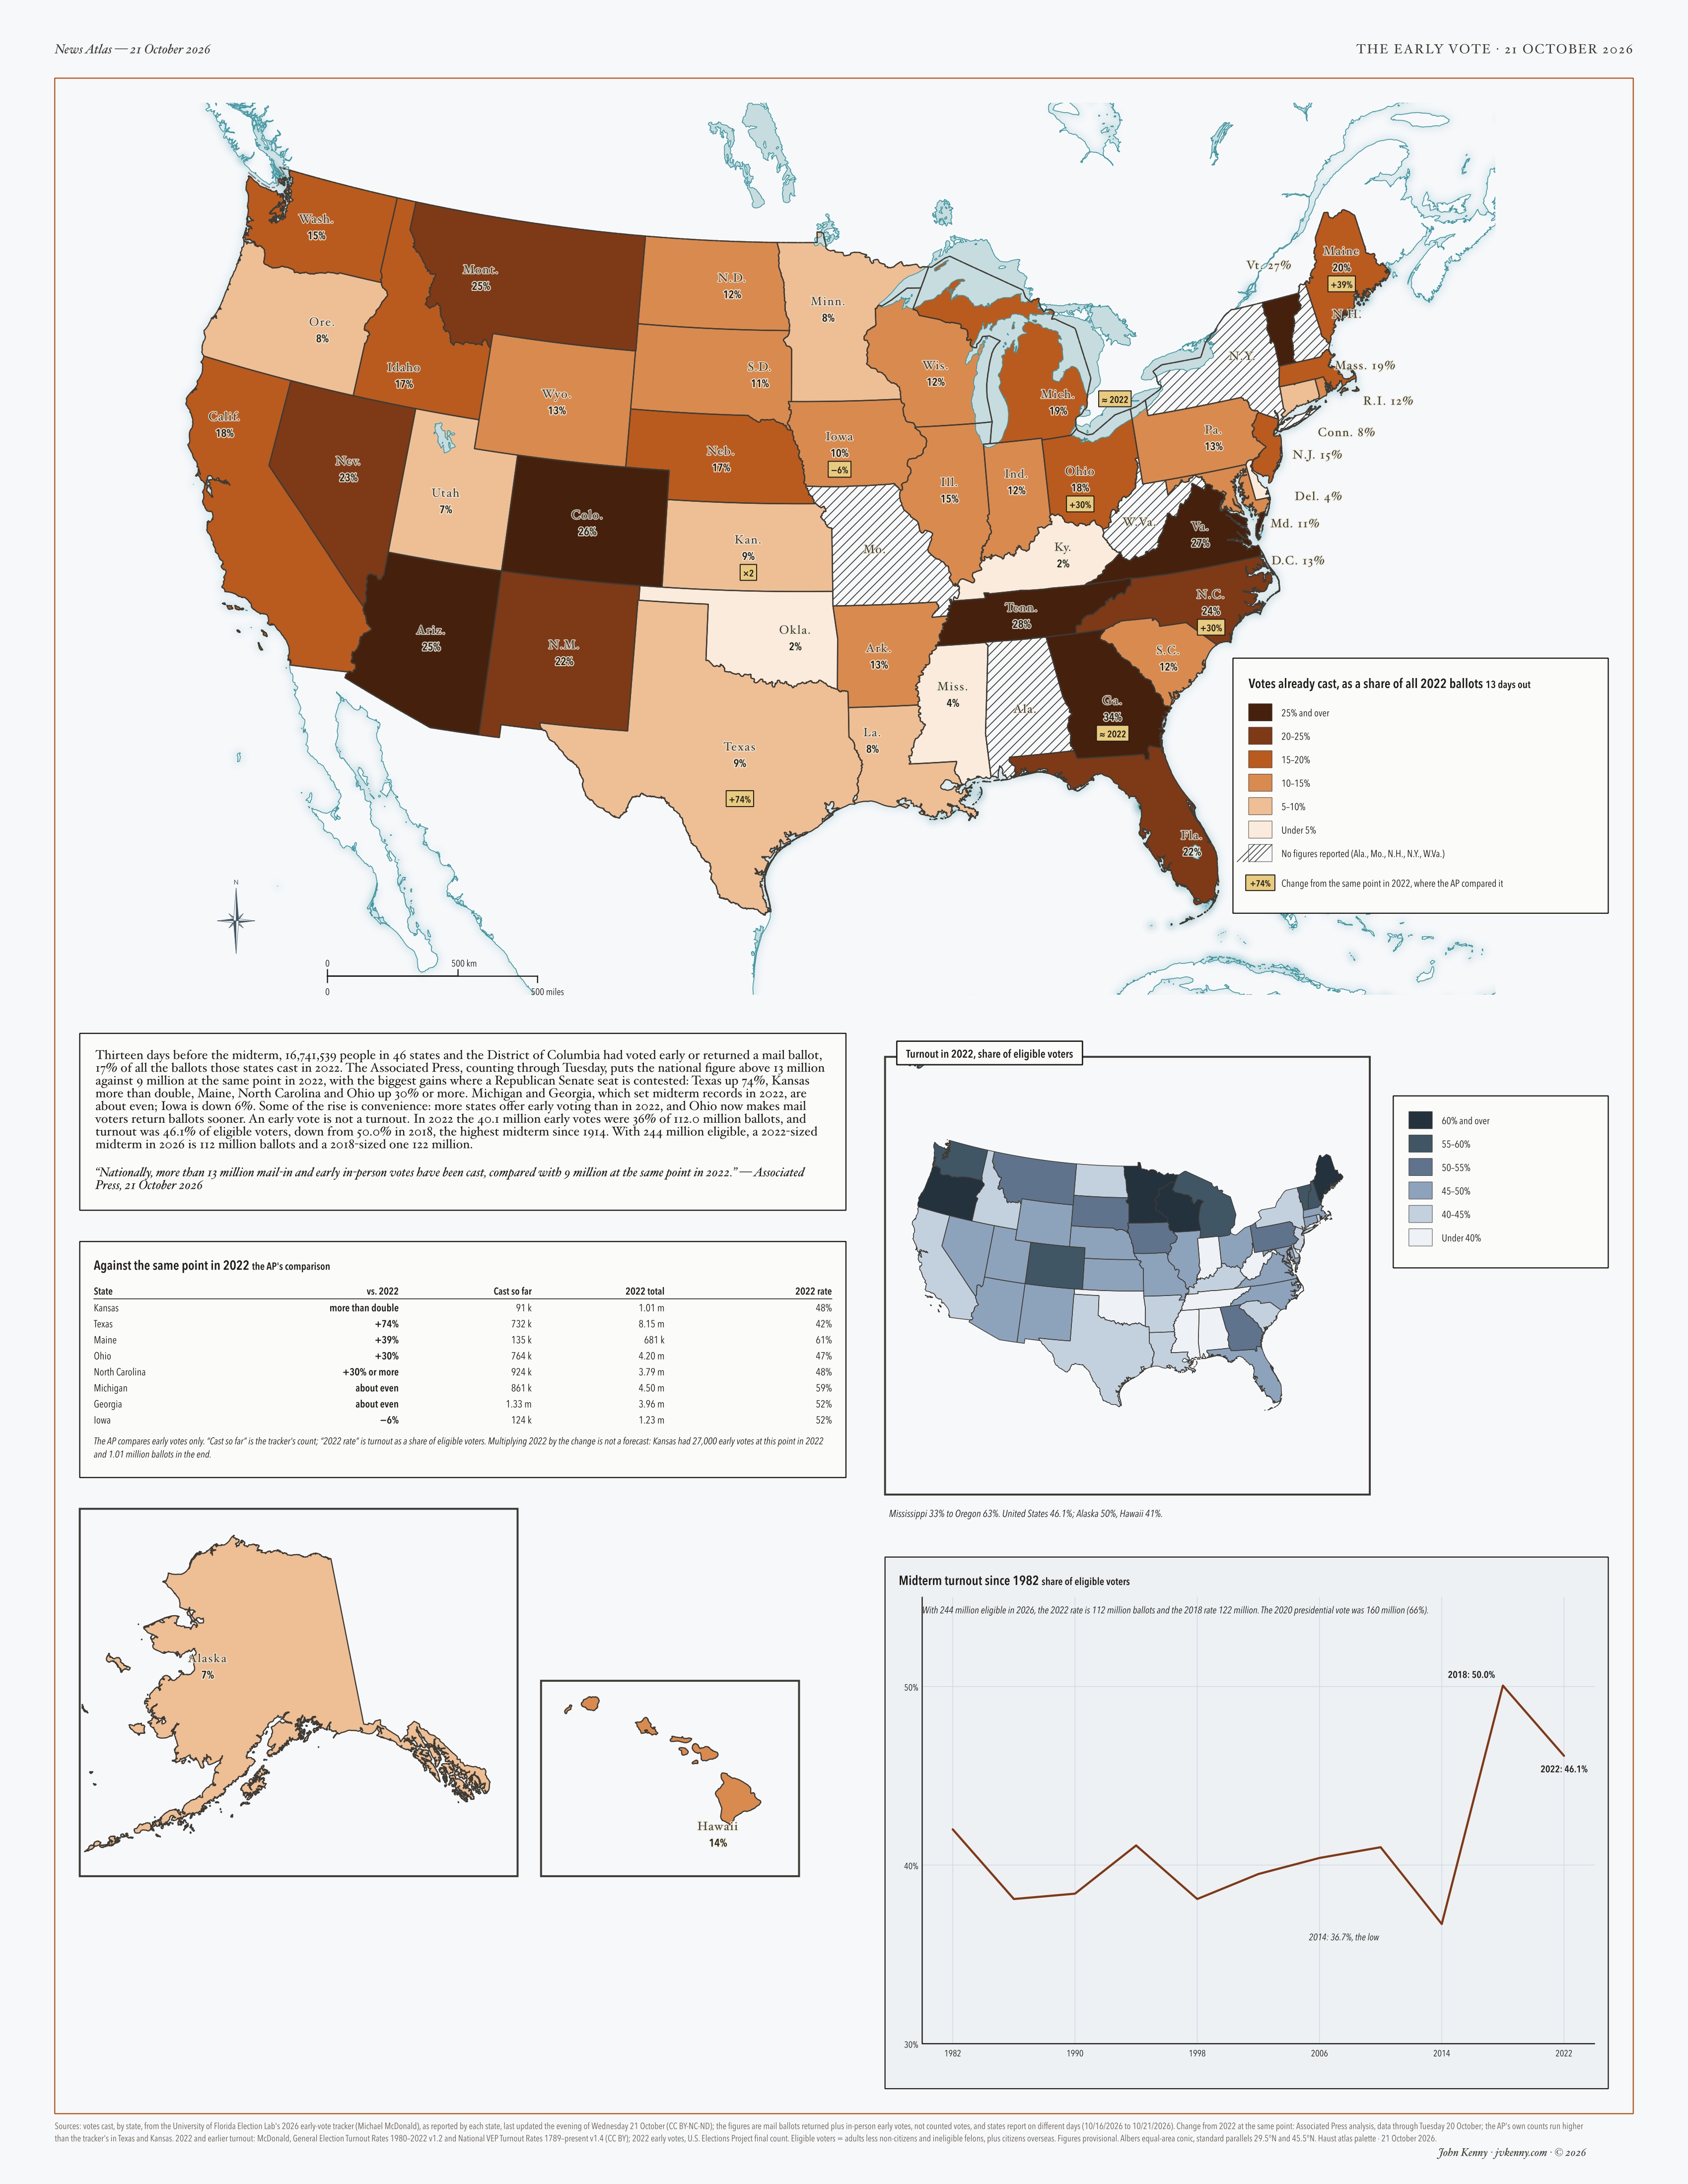
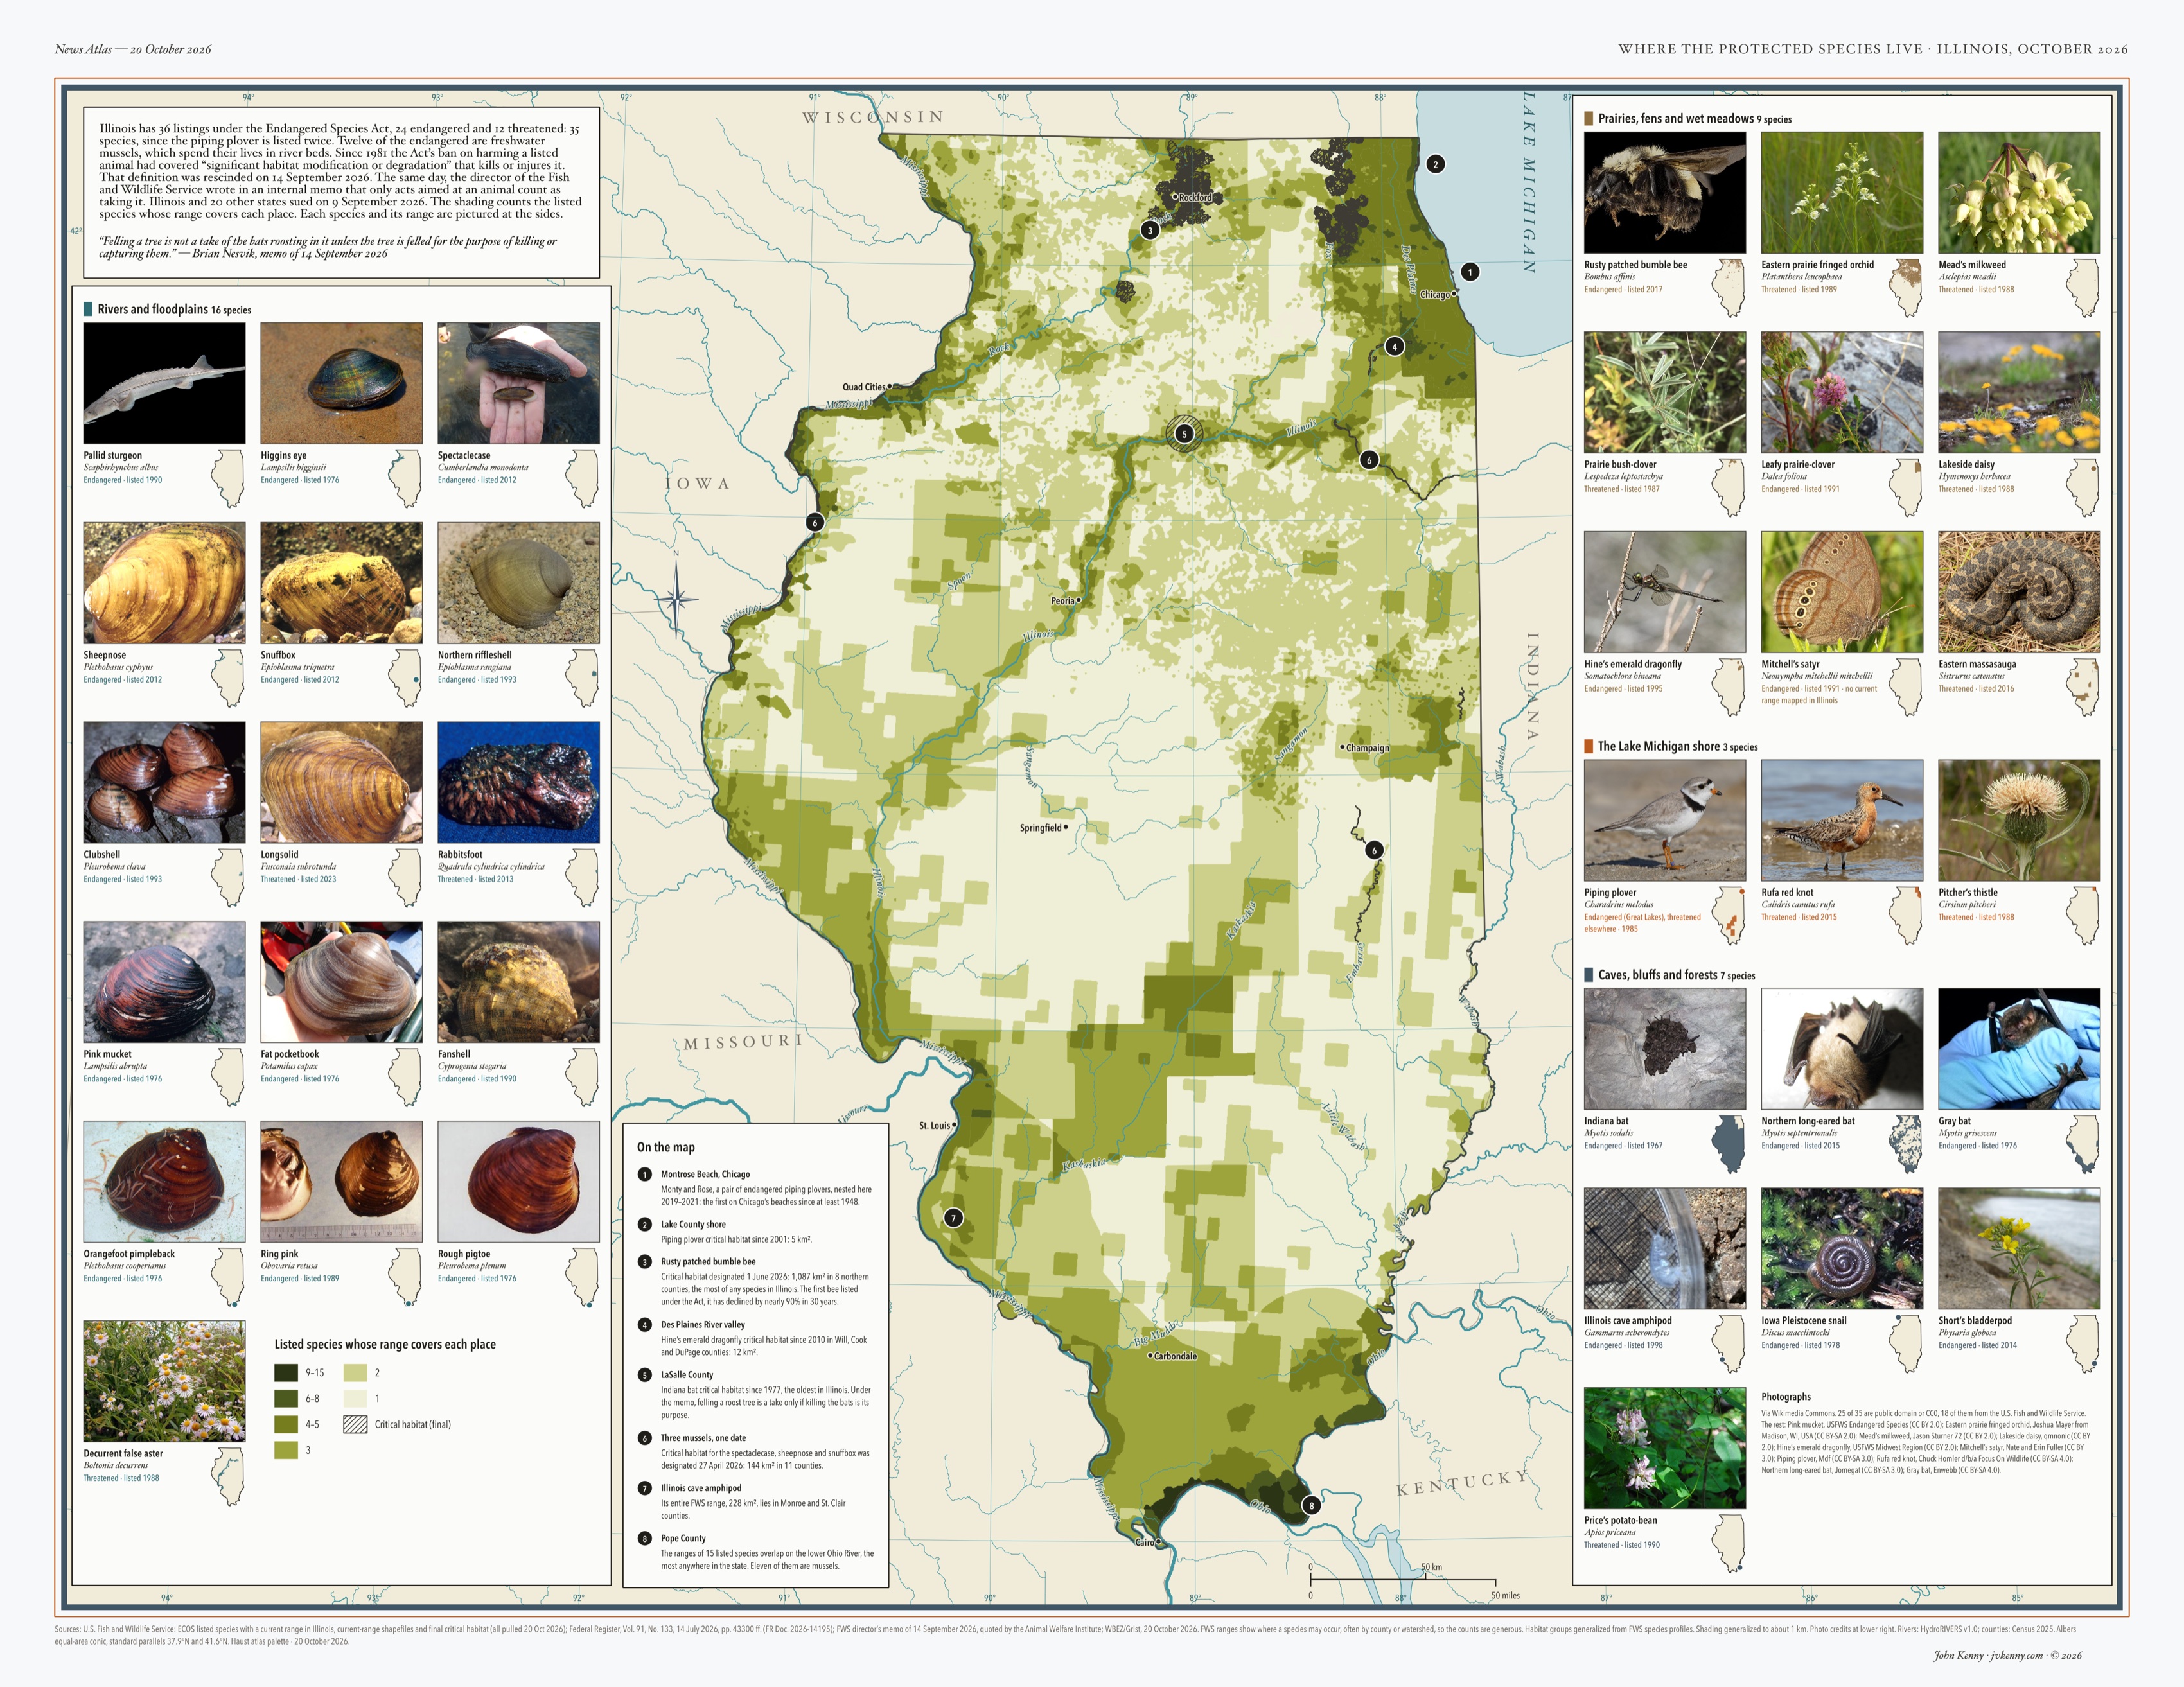
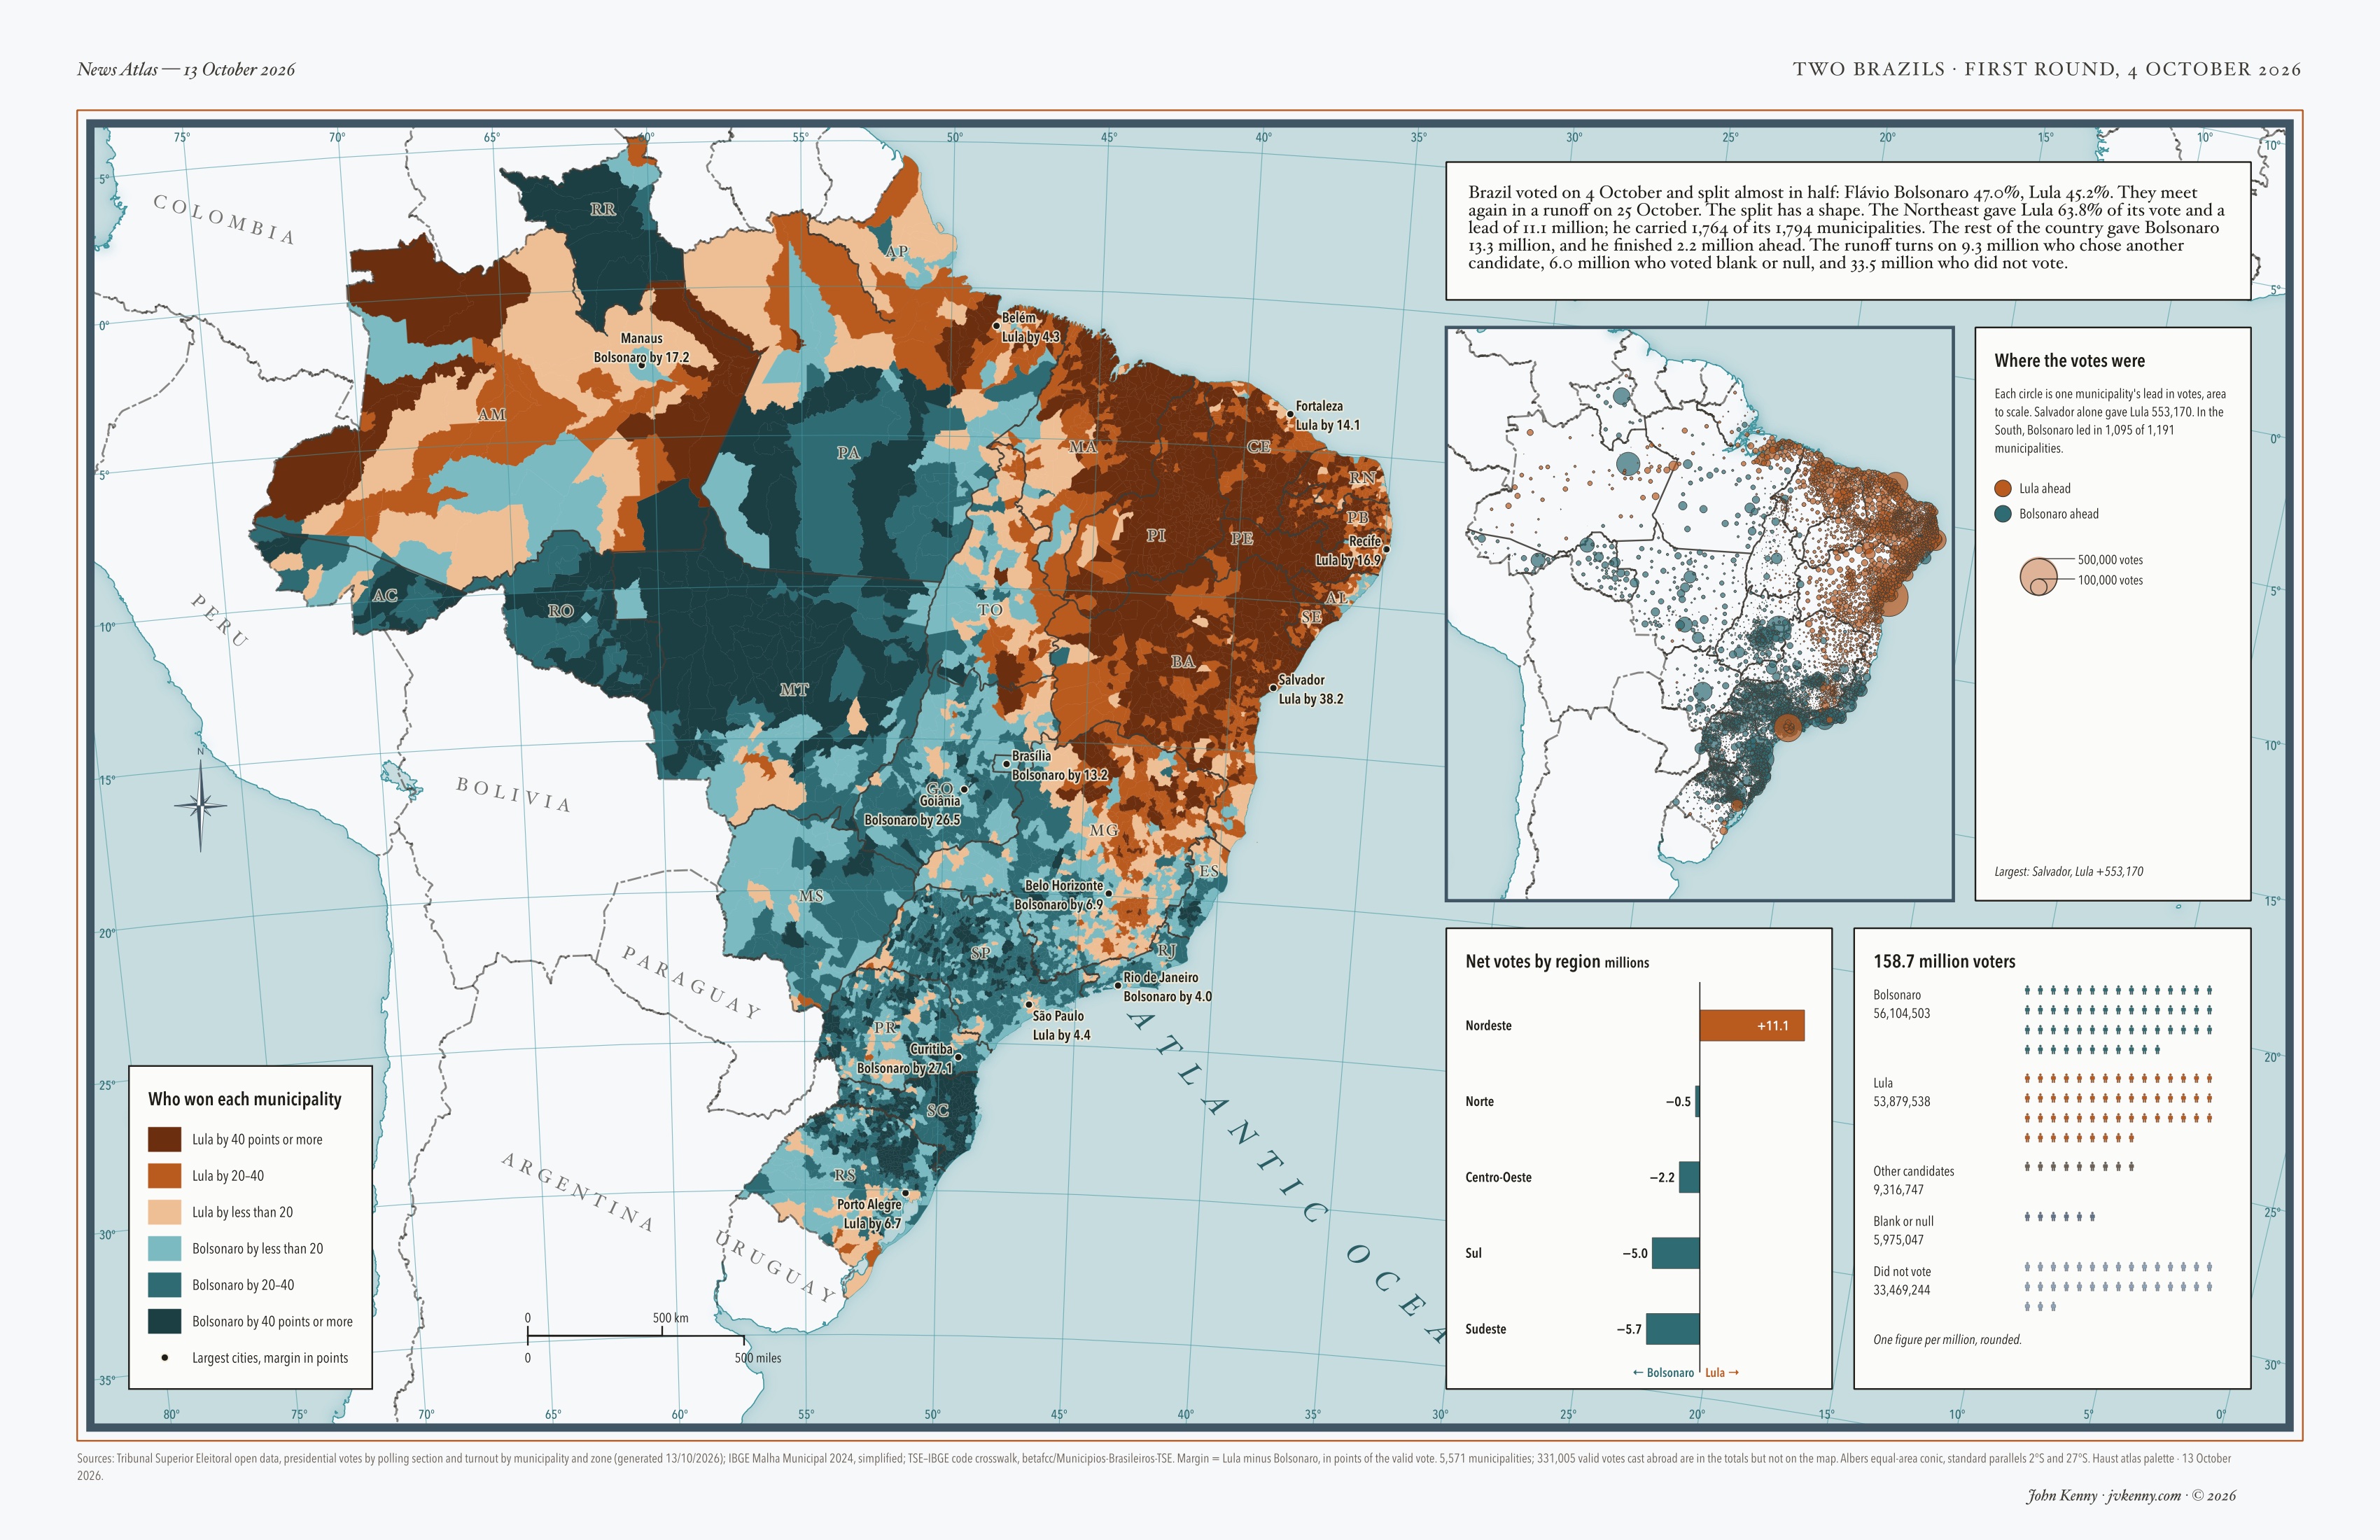
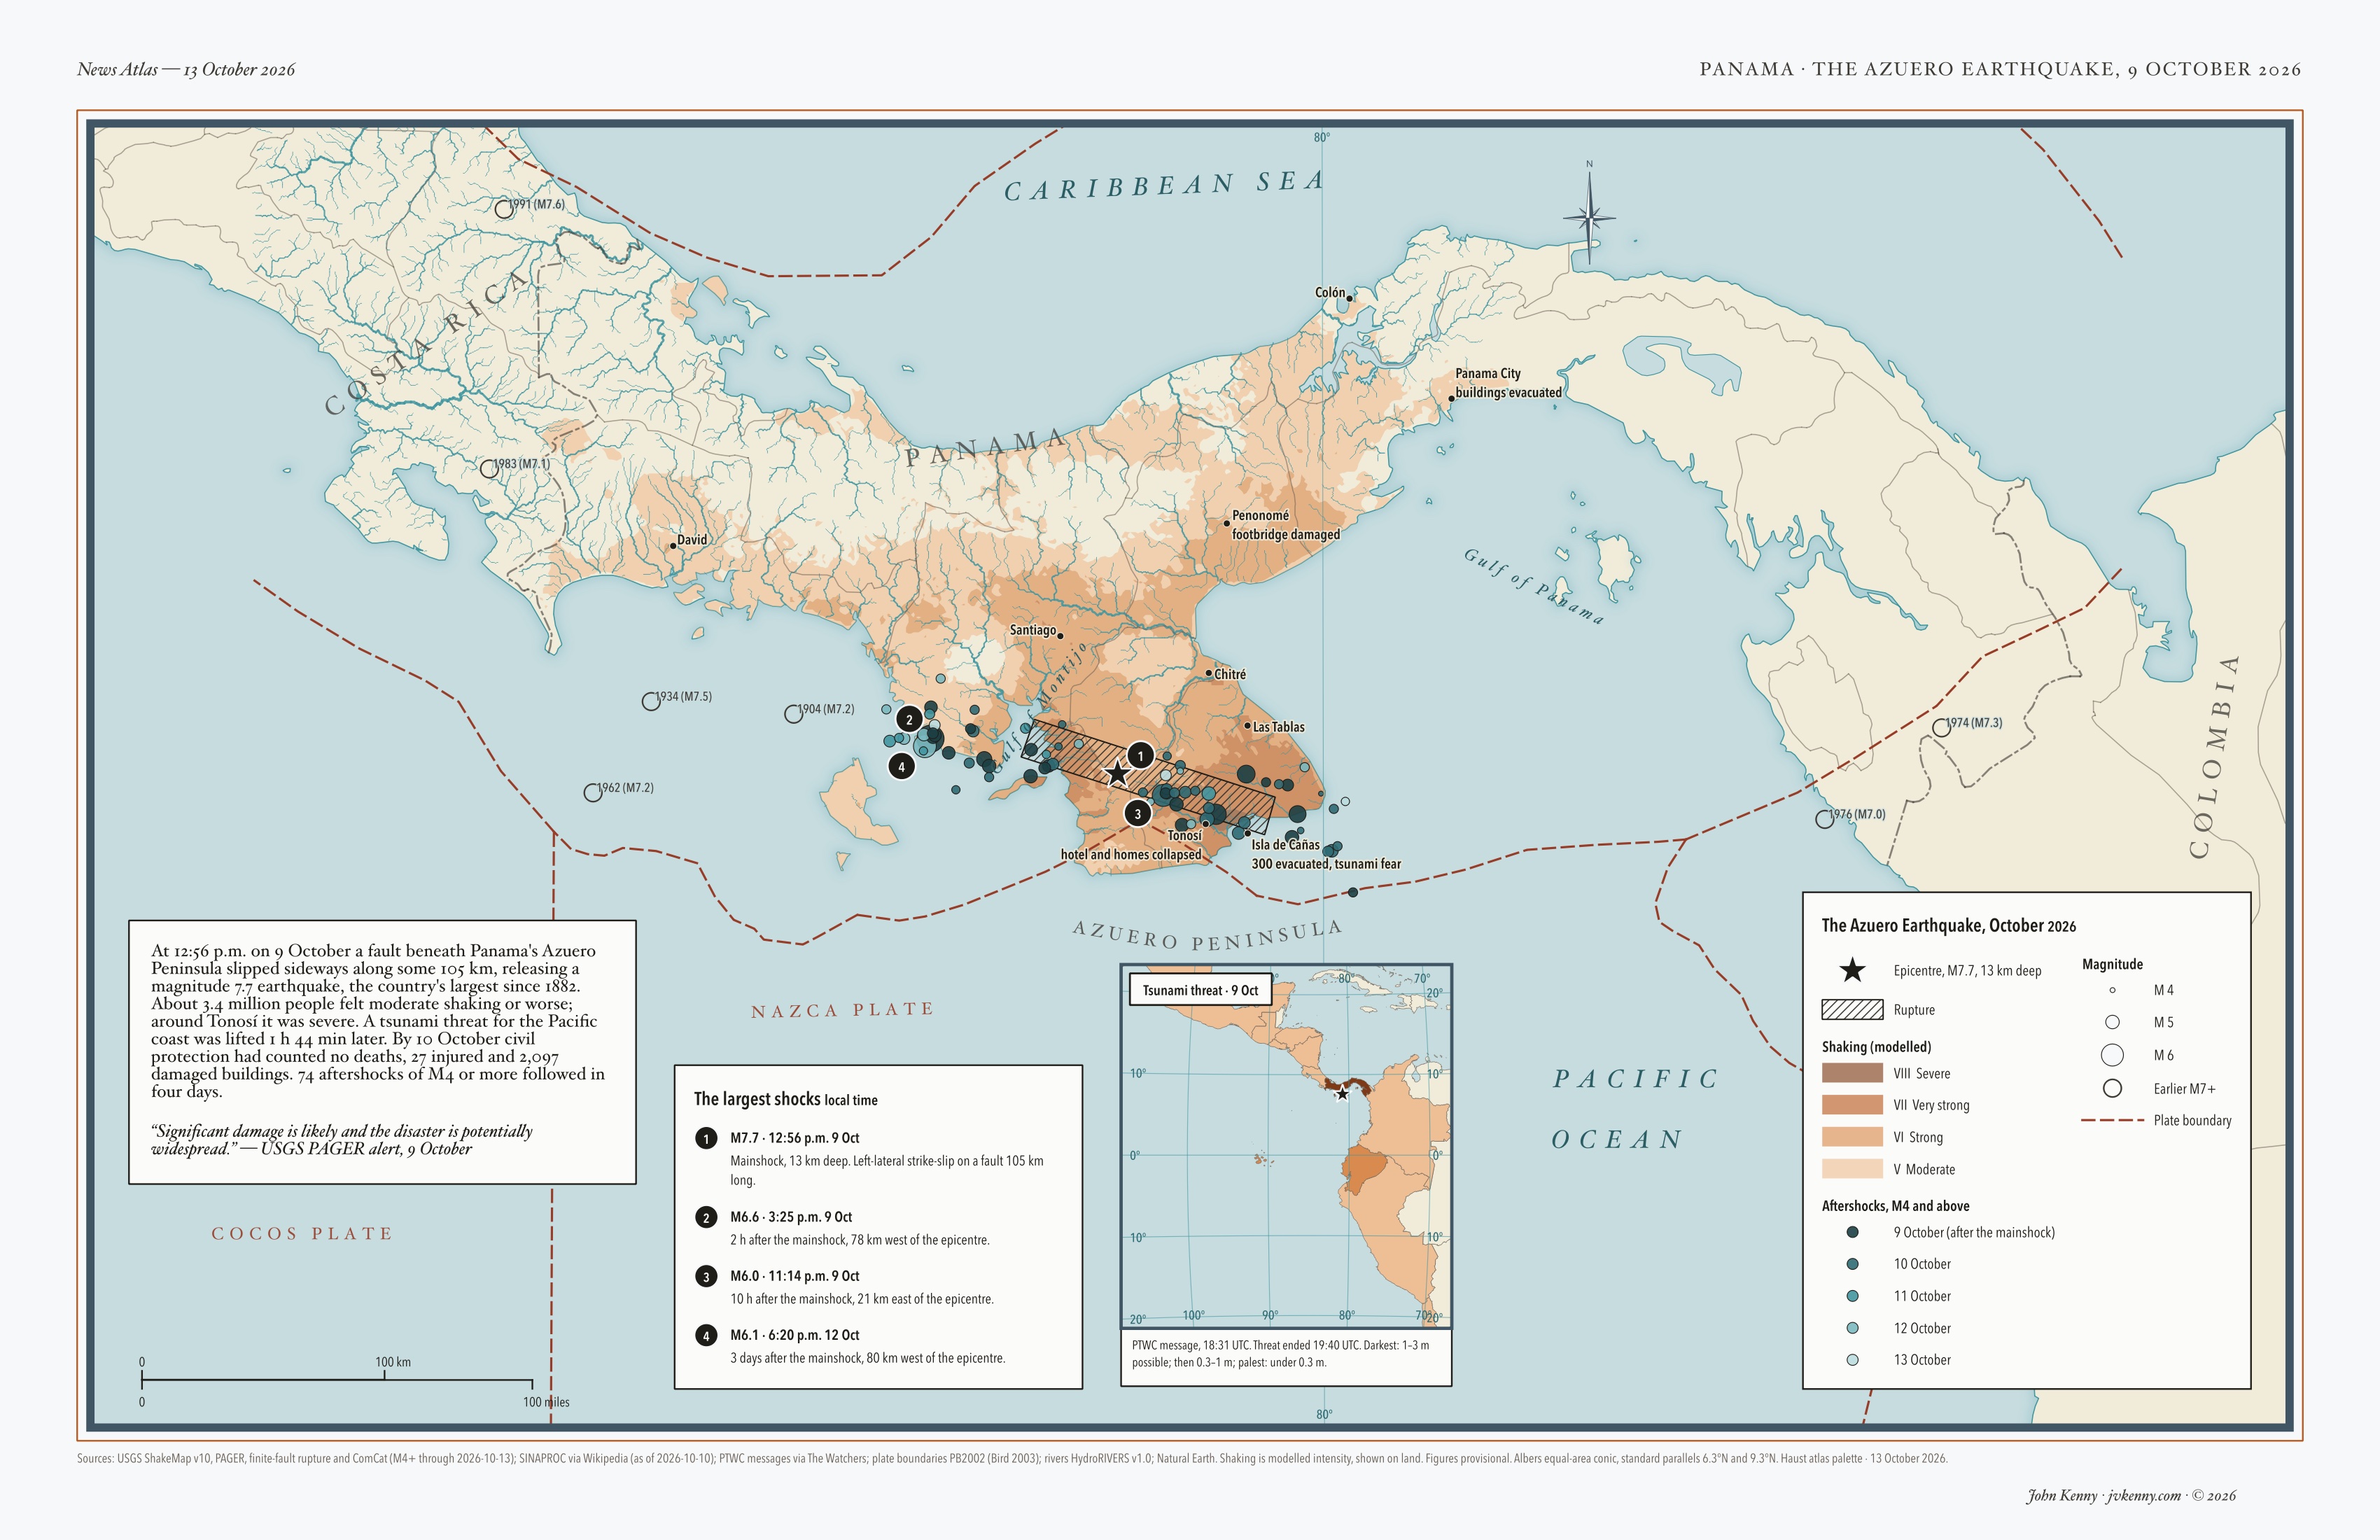
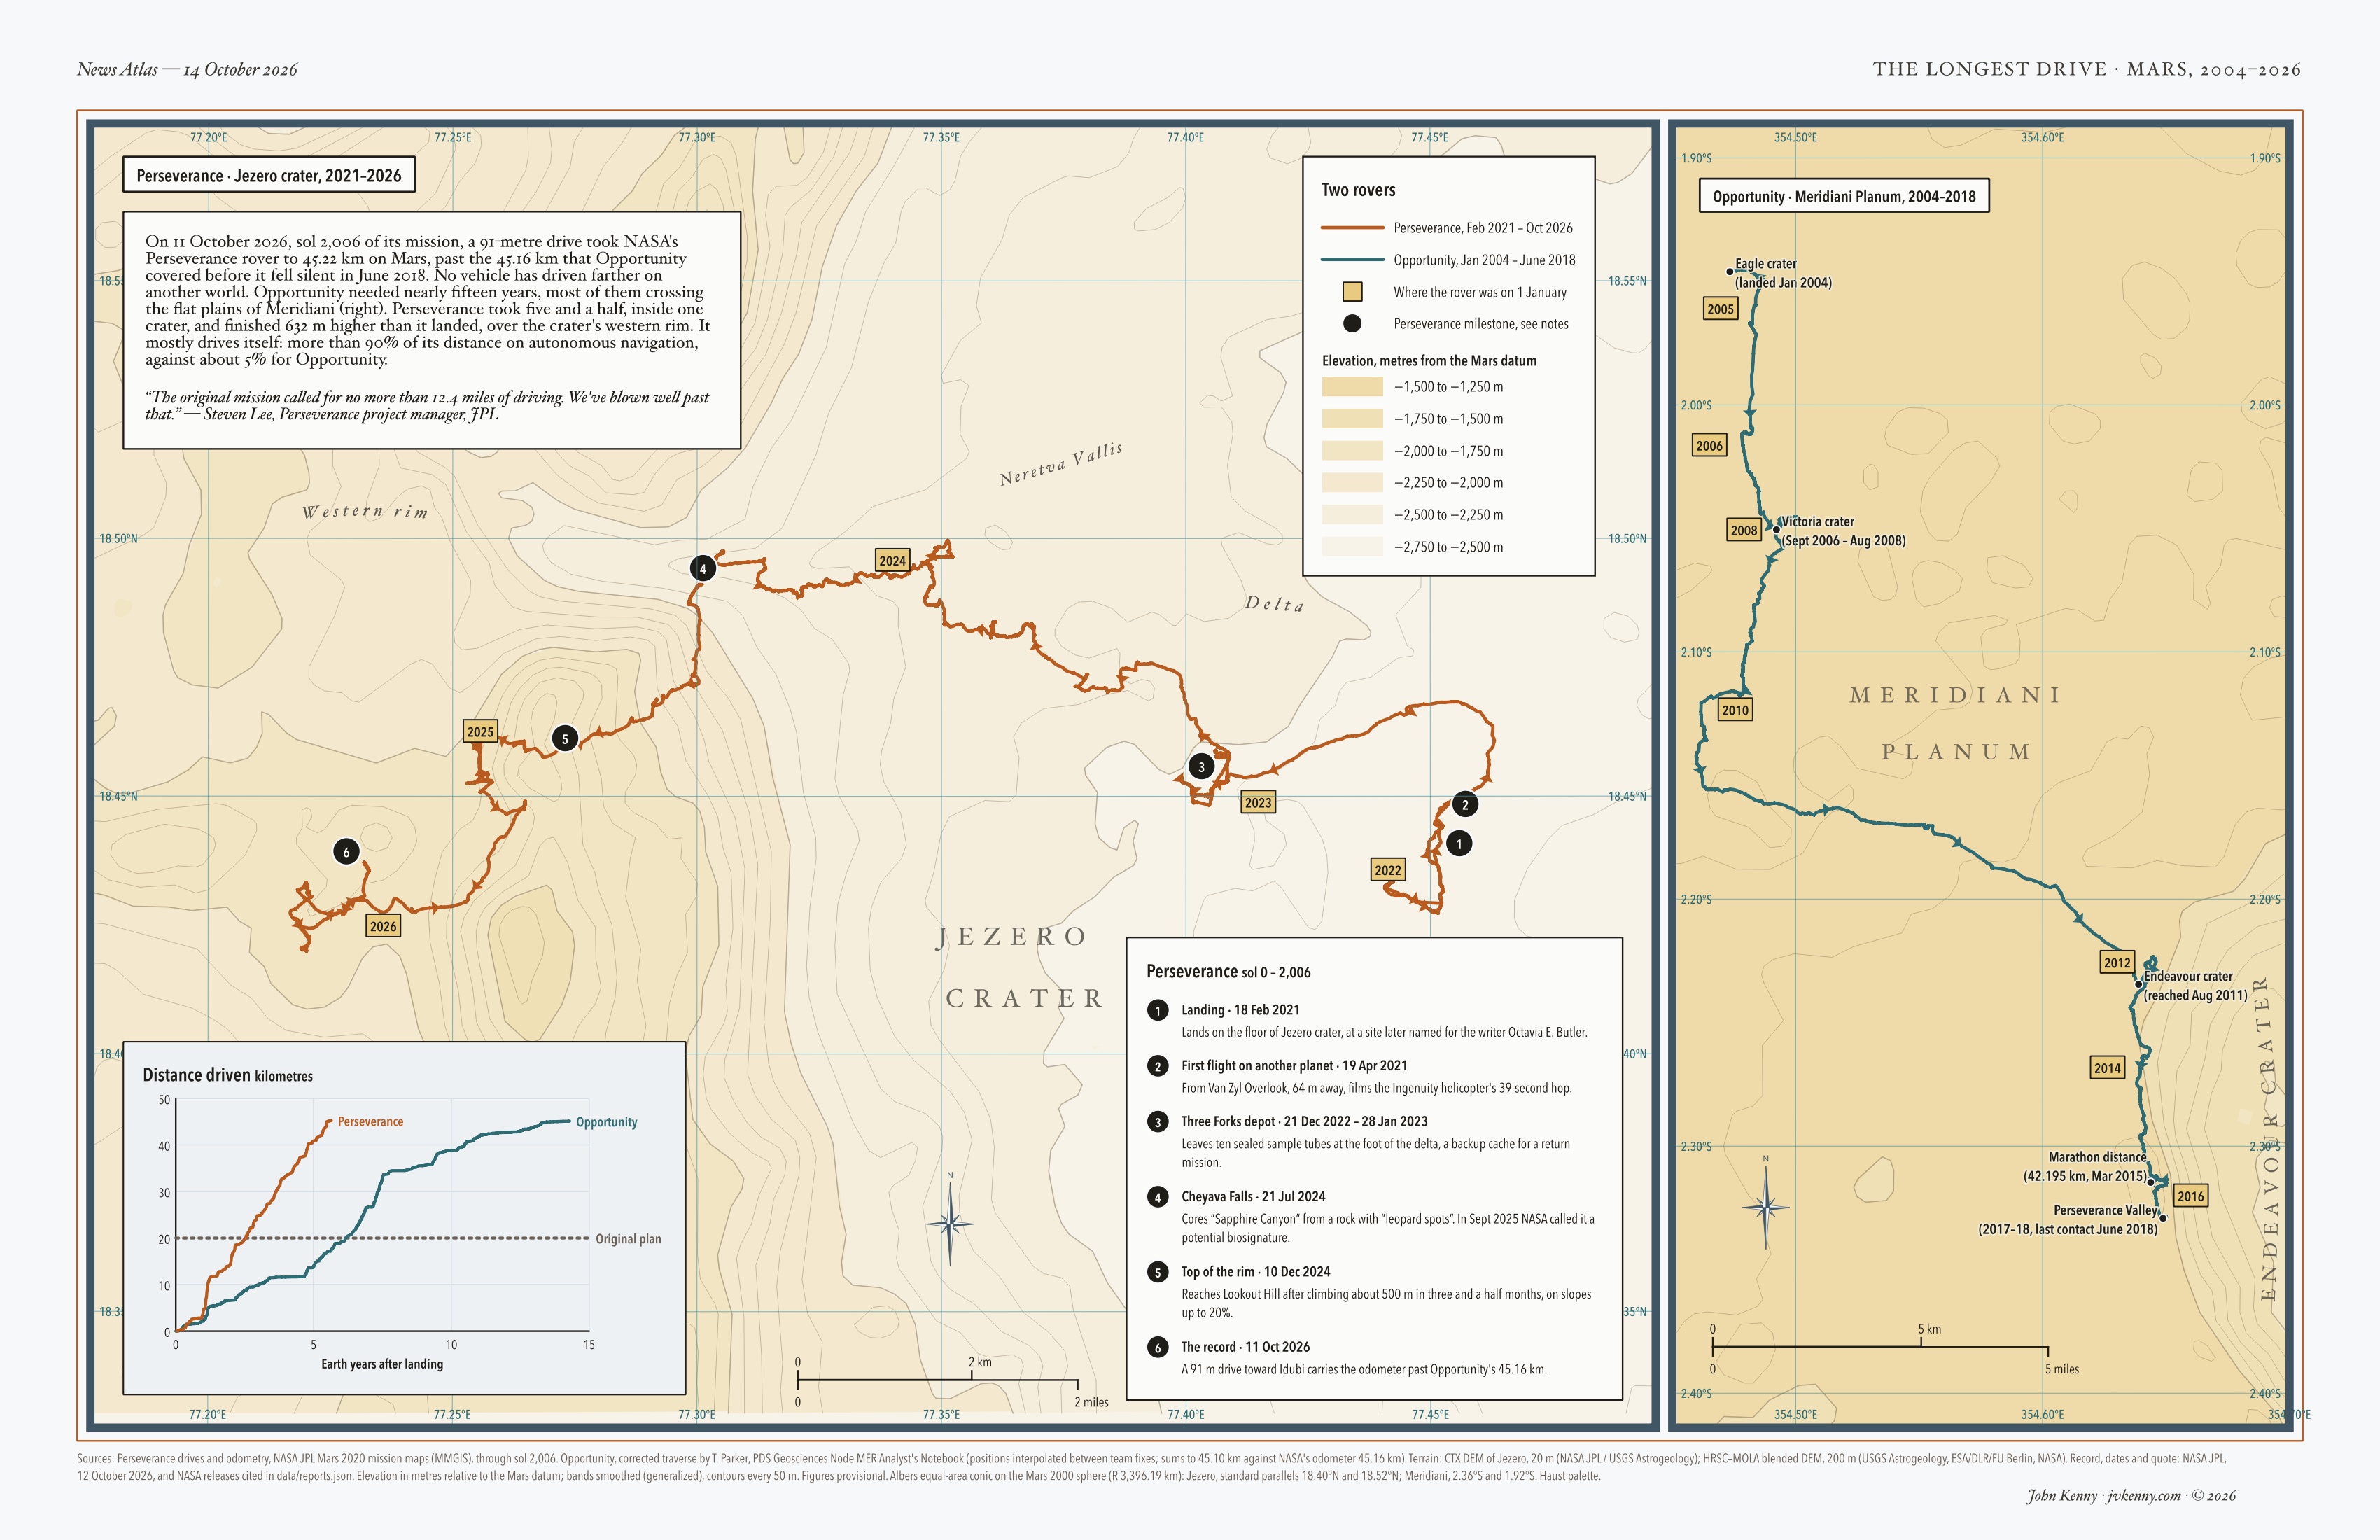
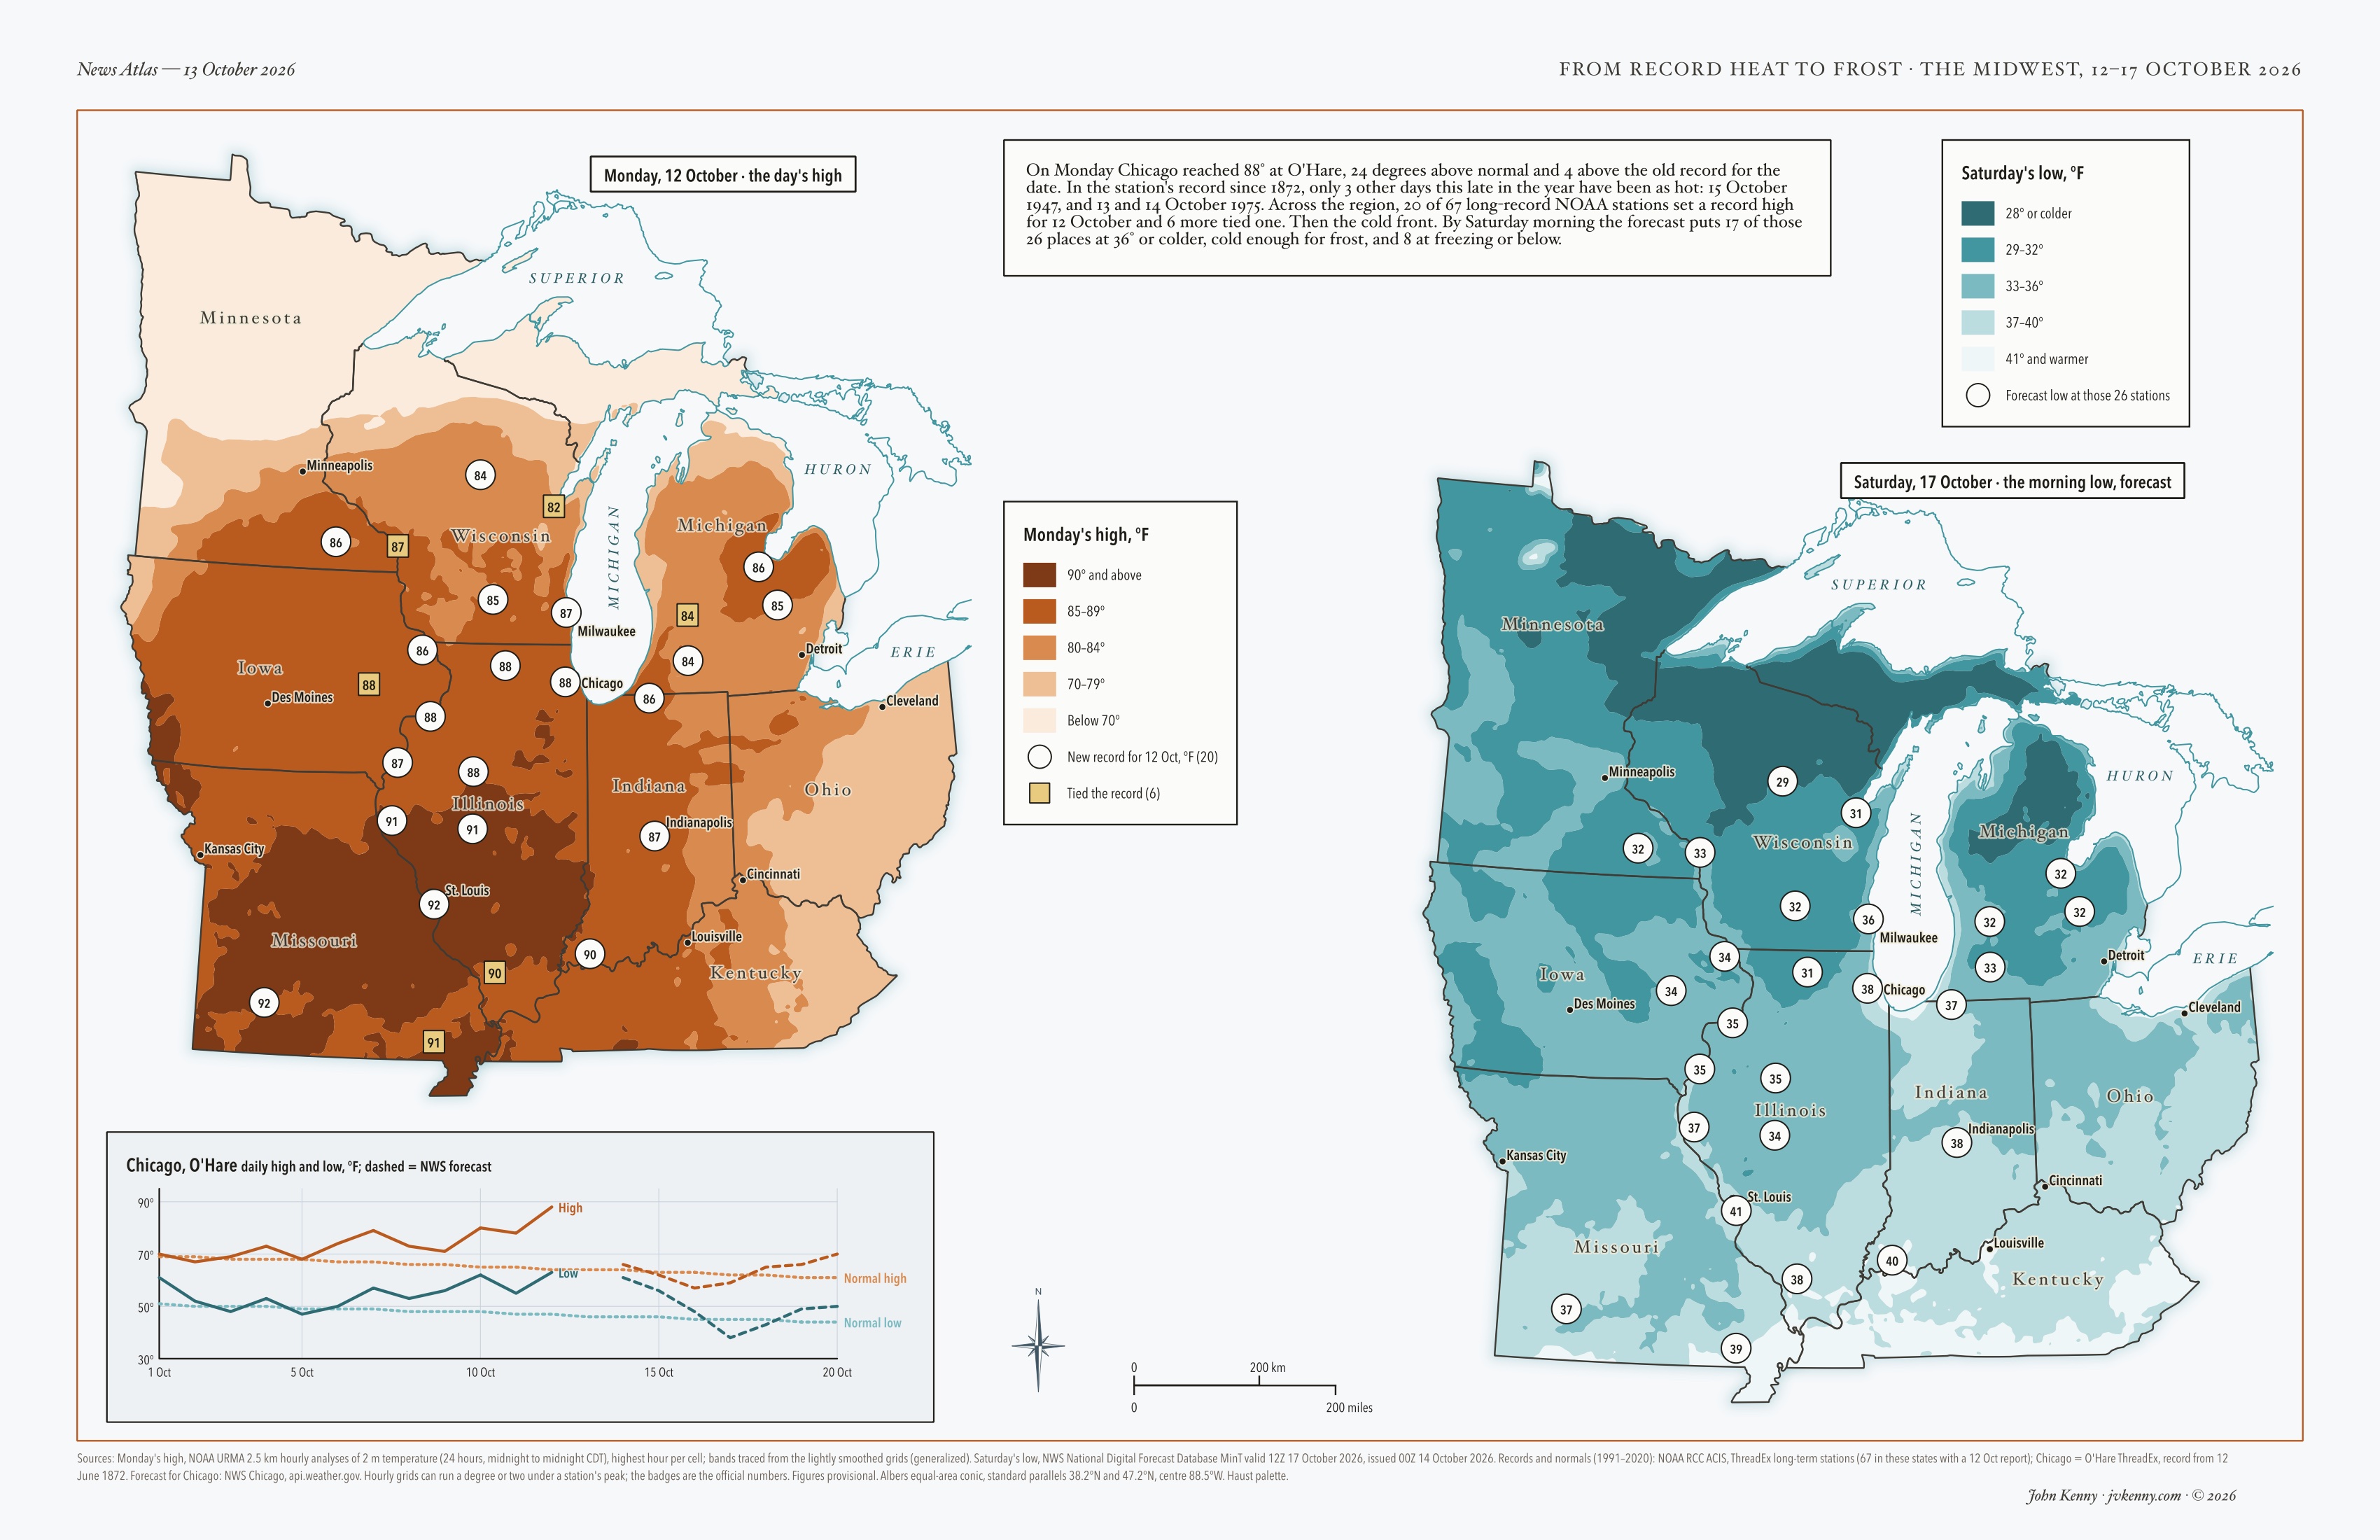
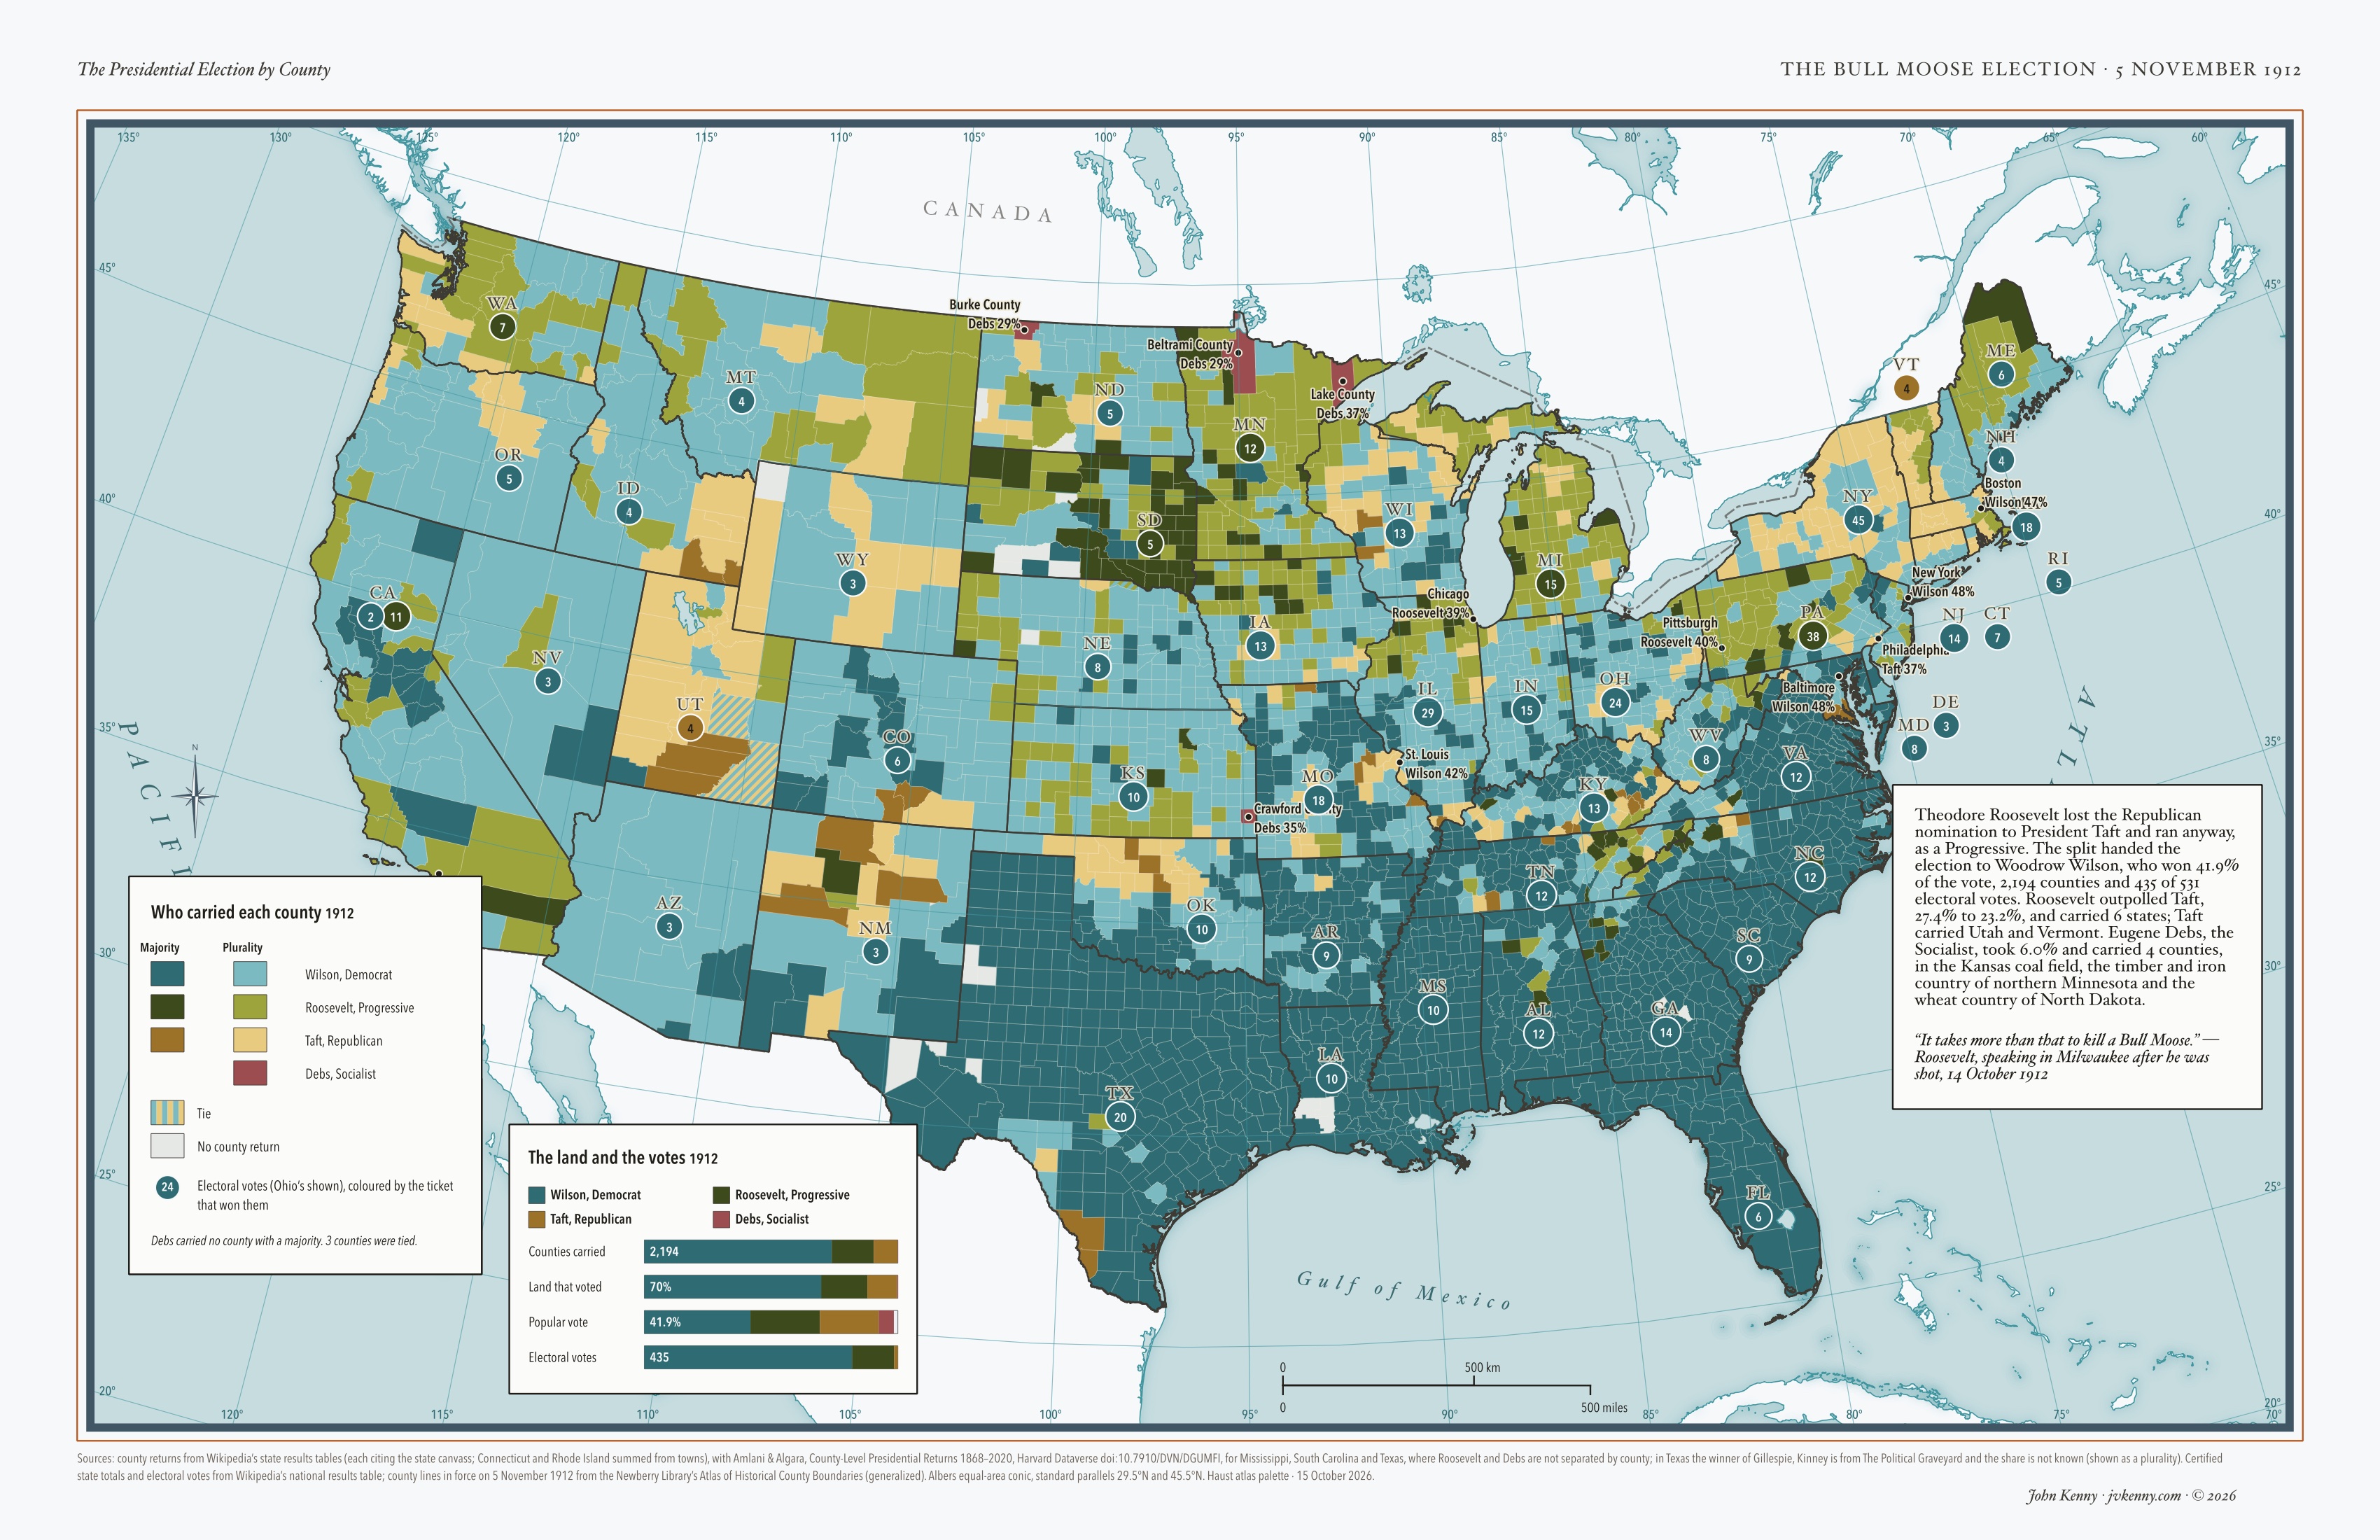
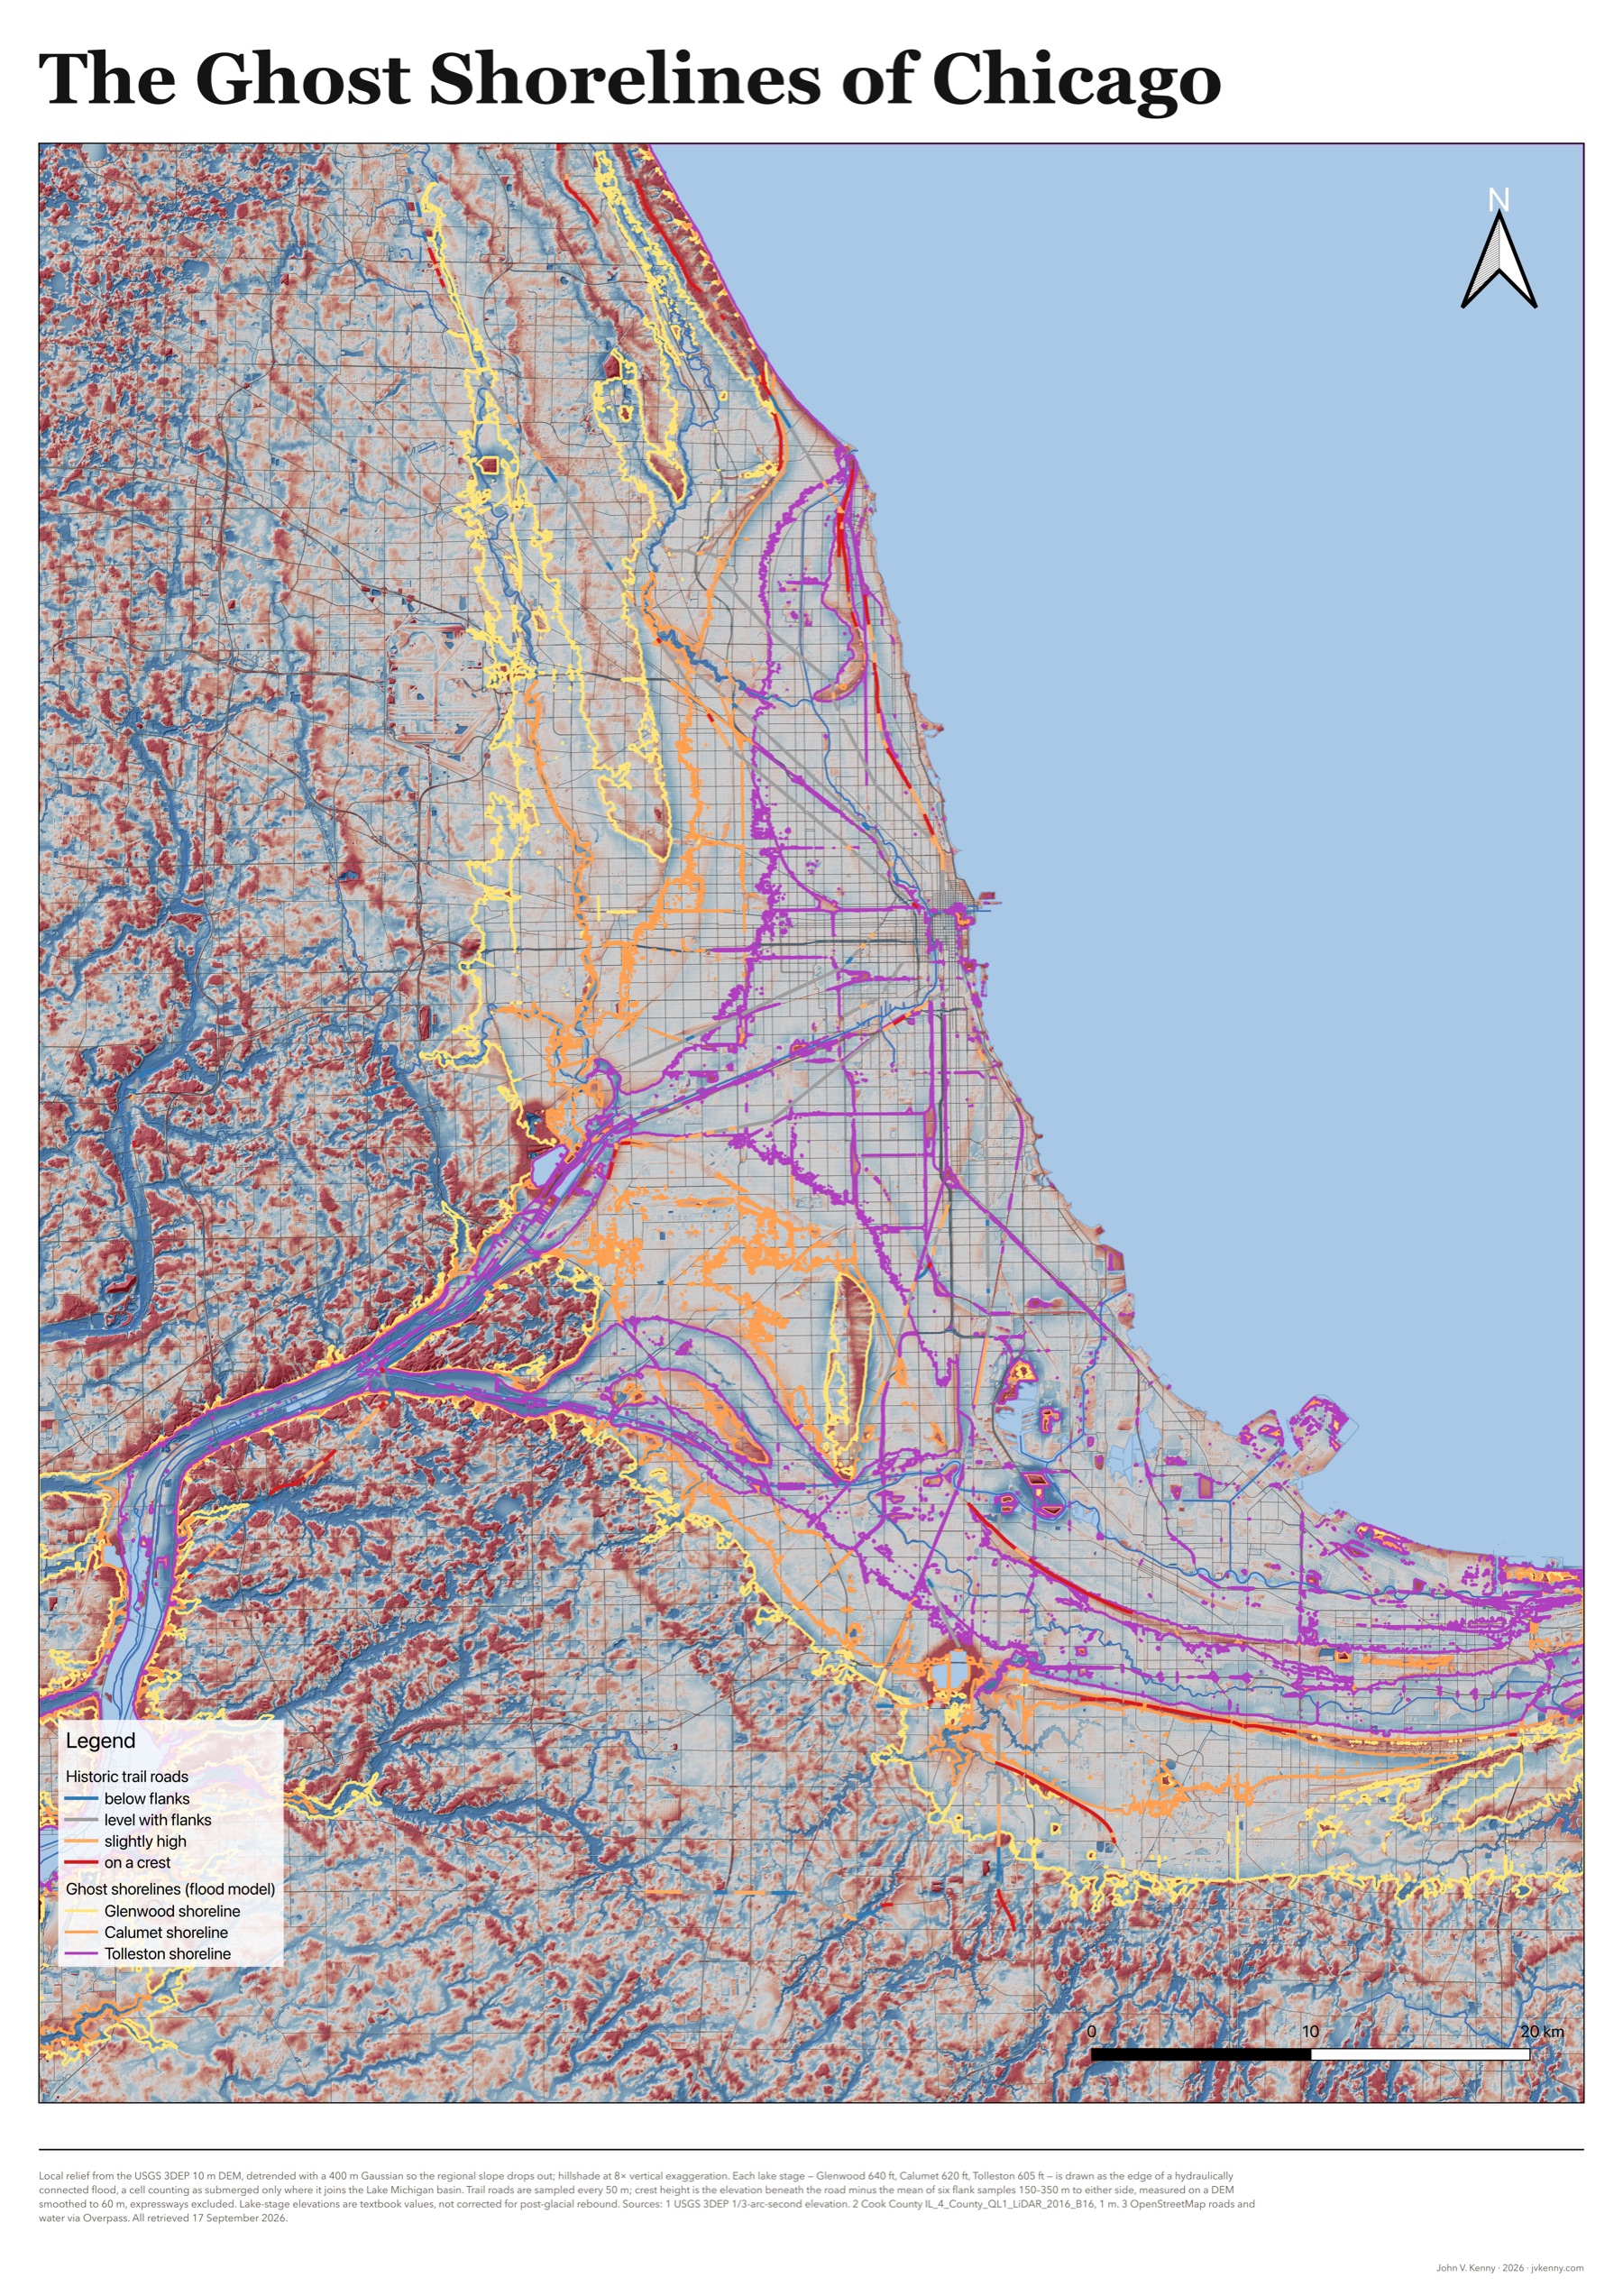
Each map carries its own sources, method notes and projection in the footer, the way a printed atlas does. Click a map to open it at full resolution.

See all maps →

Who it's for

You have the story.
I'll map where it happened.


1

Civic & democratic causes

Elections, budgets, public services, who a policy reaches. A map people can read at a glance helps them take part in the decisions that shape where they live.

2

Science & the environment

Floods, heat, shorelines, habitat. Data that's hard to see in a table becomes plain on a map, and an honest map shows its uncertainty instead of hiding it.

3

History & humanities education

Migrations, settlements, the places a story happened. Maps for classrooms, exhibits and books, in the tradition of the historical atlases this standard is built on.

4

Nonprofit reports

Funders and board members skim. A map that shows the need, the reach or the result at a glance does more work than a page of tables, and it holds up when someone asks where a number came from.

Authors, presses and family historians are welcome too.

The standard

Every map is held
to the same bar

A written cartographic standard, modelled on the great printed historical atlases and the National Park Service's map discipline. It turns taste into rules that can be checked, so the twentieth map is as careful as the first.

One map, one message

The takeaway is written down in one sentence first. Everything on the page serves it, and anything that doesn't is cut.

A quiet base, a loud subject

Rivers, coastlines and borders are rich but muted. The story is the only saturated thing on the page, and the eye goes straight there.

The right device for the data

Movement gets routes with direction, volume gets flows sized by count, change over time gets side-by-side panels, and uncertainty gets soft edges instead of hard lines.

Type that does two jobs

A classical serif names the land and water; a condensed sans names what happened there. At a glance you can tell geography from events.

Every number traceable

Figures are computed from the source data when the map is rendered, never typed in by hand. Sources, dates, projection and caveats are printed on the page.

Readable by everyone

Palettes tested for colorblind readers, text contrast checked rather than eyeballed, and alt text written for every image.

How it works

From a conversation
to a finished map


  1. 1

    Tell me the story

    A short call or email about what the map has to say, who reads it, and where it will be printed. You get an honest answer on whether a map will help.

  2. 2

    I find the data

    Your data, public sources, or both. I do the digging, cleaning and checking, and tie every number and boundary to where it came from.

  3. 3

    Draft, then revise

    You see a draft early, while changes are cheap. We fix what's wrong and cut what doesn't earn its place. Two rounds of revision are included.

  4. 4

    What you get

    A vector PDF your printer will accept, a high-resolution image for screen, the source list, and the editable map project if you want it, with the rights to publish.

The News Atlas

One story, one map, inspired by the cartography of an atlas. Lately I've been exploring how data and maps can help us see the news: what happened, where, and how far it reached. I use Claude to help gather the data and build the map. I choose the stories and check every number.

Who's making them

I'm John Kenny, a GIS professional in Chicago. I've spent my career making maps that people have to act on, for city councils, engineers and the public, and these maps bring that discipline to stories. More about me

Commissions open

Have a map in mind?

Tell me about the story, the reader and the deadline. If a map will make it land, I'll tell you what it would take and what it would cost. If it won't, I'll tell you that too.

John Kenny · jvkenny.com · © 2026 i