The News Atlas · 8 maps

All the maps

One story, one map, every figure sourced. The maps marked Live open as interactive maps: zoom in, point at any place for its numbers, and step through the numbered notes. Each one links to its printed version.


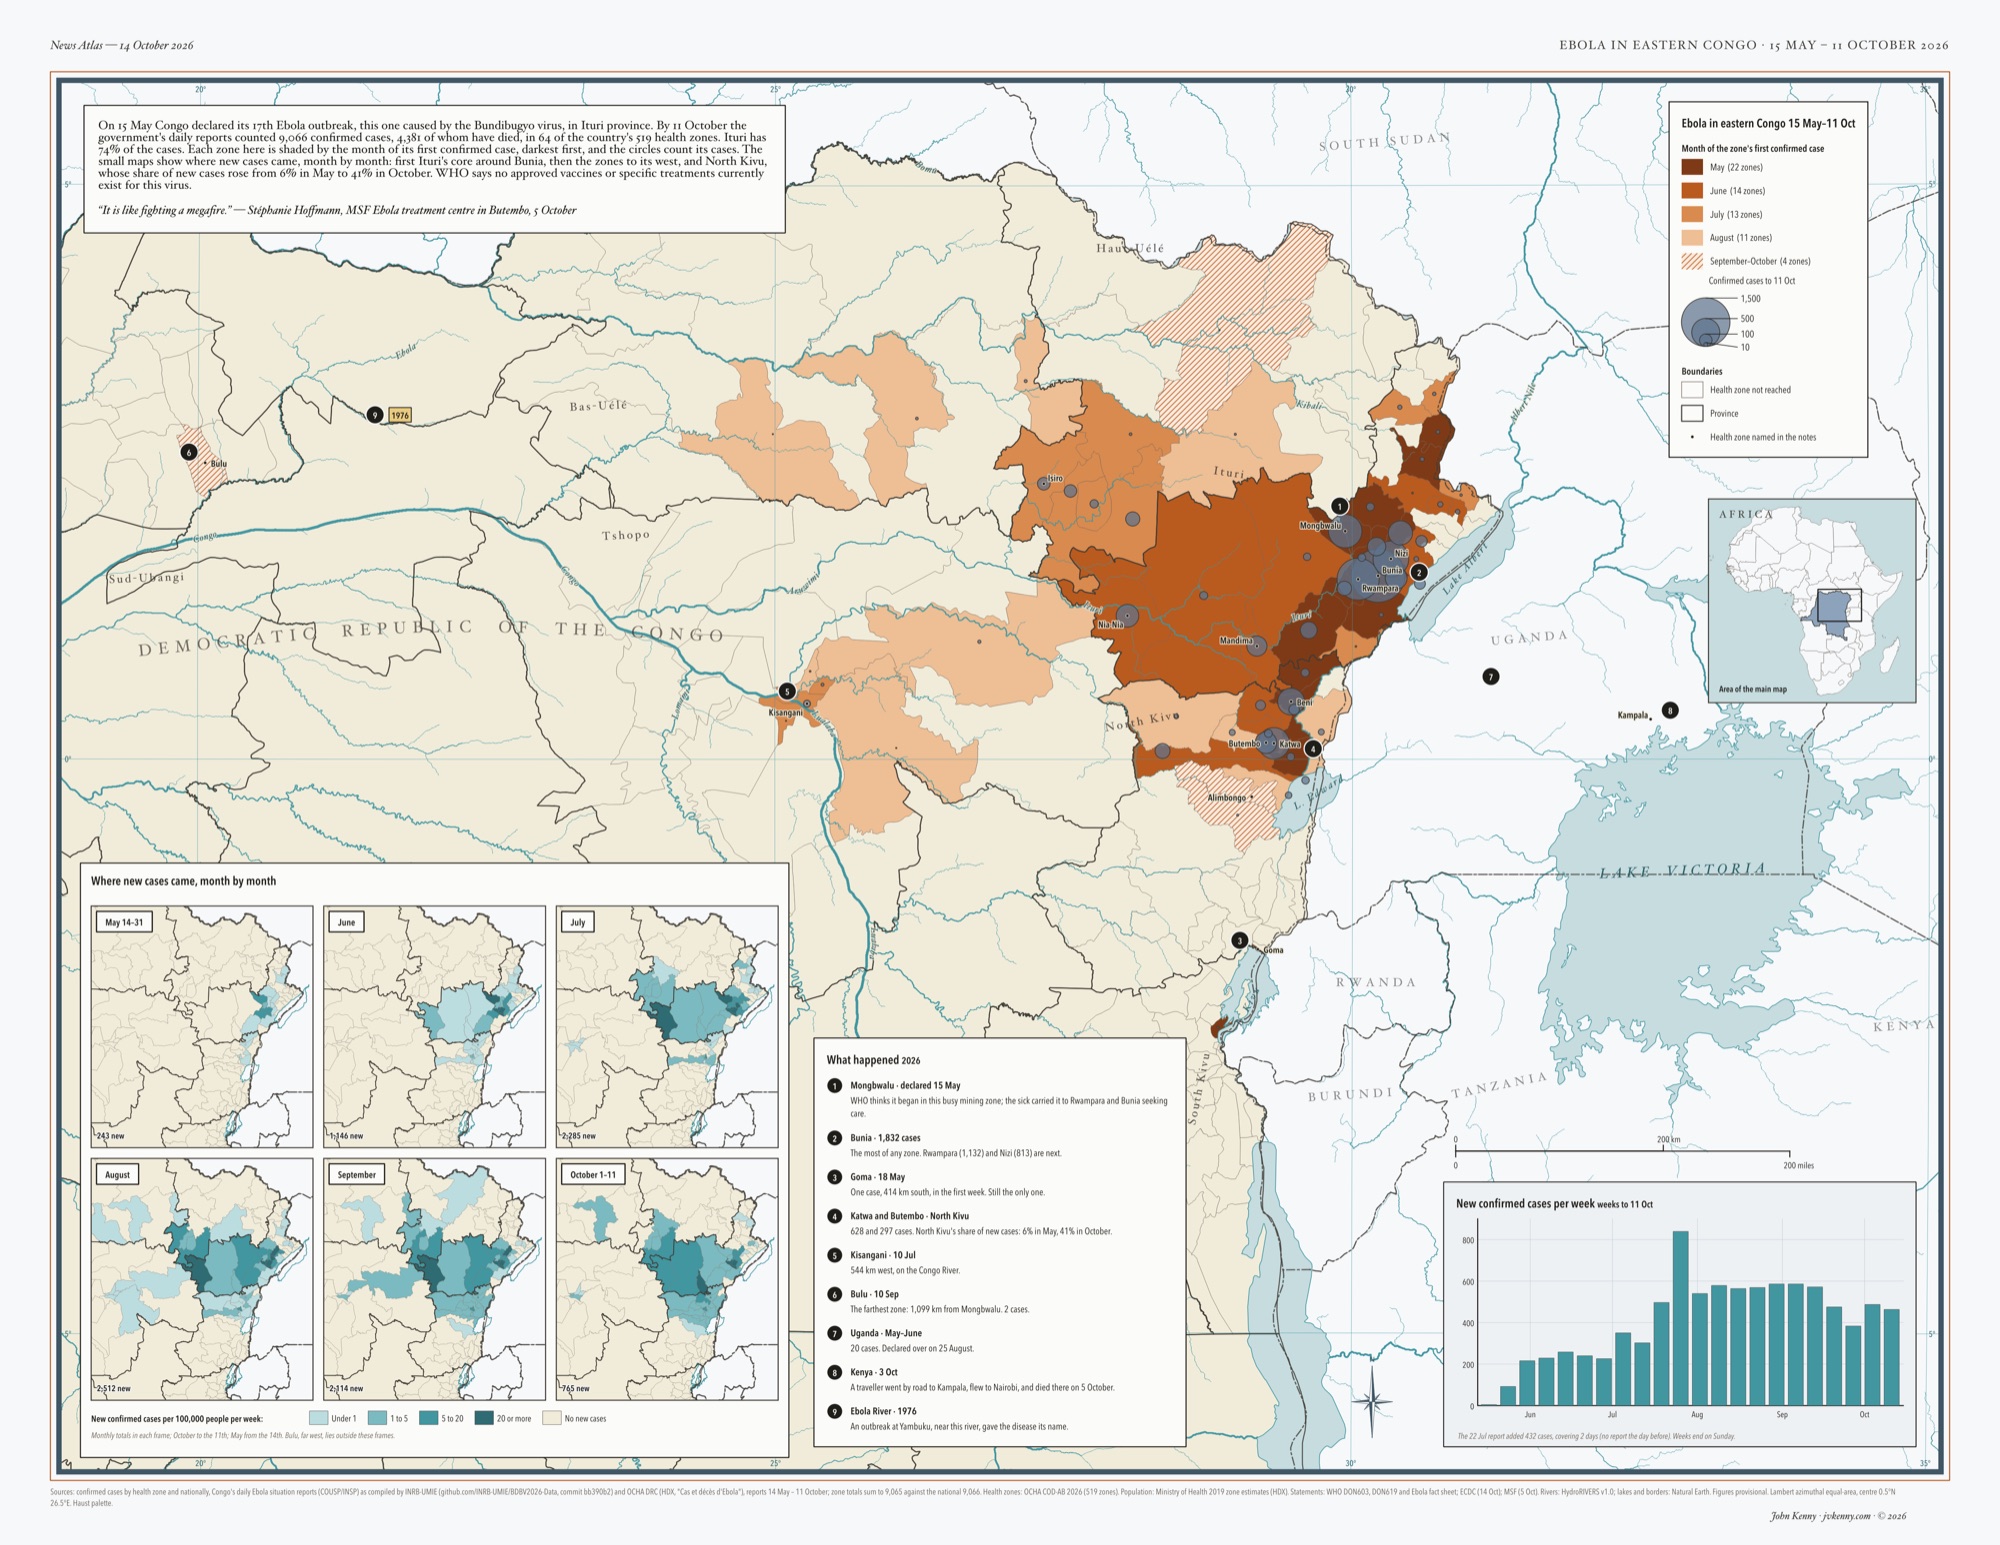
  1. Map of north-eastern Democratic Republic of the Congo and its neighbours, with the outbreak's health zones shaded in rust: darkest for zones reached in May around Bunia and Mongbwalu in Ituri province, lighter for June, July and August as the outbreak spread west toward Kisangani and north into Haut-Uélé, and hatched for the four zones reached in September and October, including Bulu far to the west. Grey-blue circles sized by confirmed cases cluster around Bunia, Rwampara and Nizi and run south through Beni, Butembo and Katwa in North Kivu. Nine numbered notes mark where the outbreak began, Goma, Kisangani, Bulu, Uganda, Kenya's case at Kampala and the Ebola River. Six small teal maps show new cases per 100,000 people per week from May to October, the darkest zones moving from Ituri's core westward and into North Kivu. A bar chart gives new confirmed cases per week, and an Africa inset locates the map.

    News Atlas · Congo · May–Oct 2026 · 17 × 22 in

    Ebola in eastern Congo, 15 May – 11 October 2026, from the government's daily situation reports by health zone. Each zone is shaded by the month the outbreak reached it; six small maps follow where new cases came each month, from Bunia into North Kivu. 9,066 confirmed cases in 64 zones by 11 October.

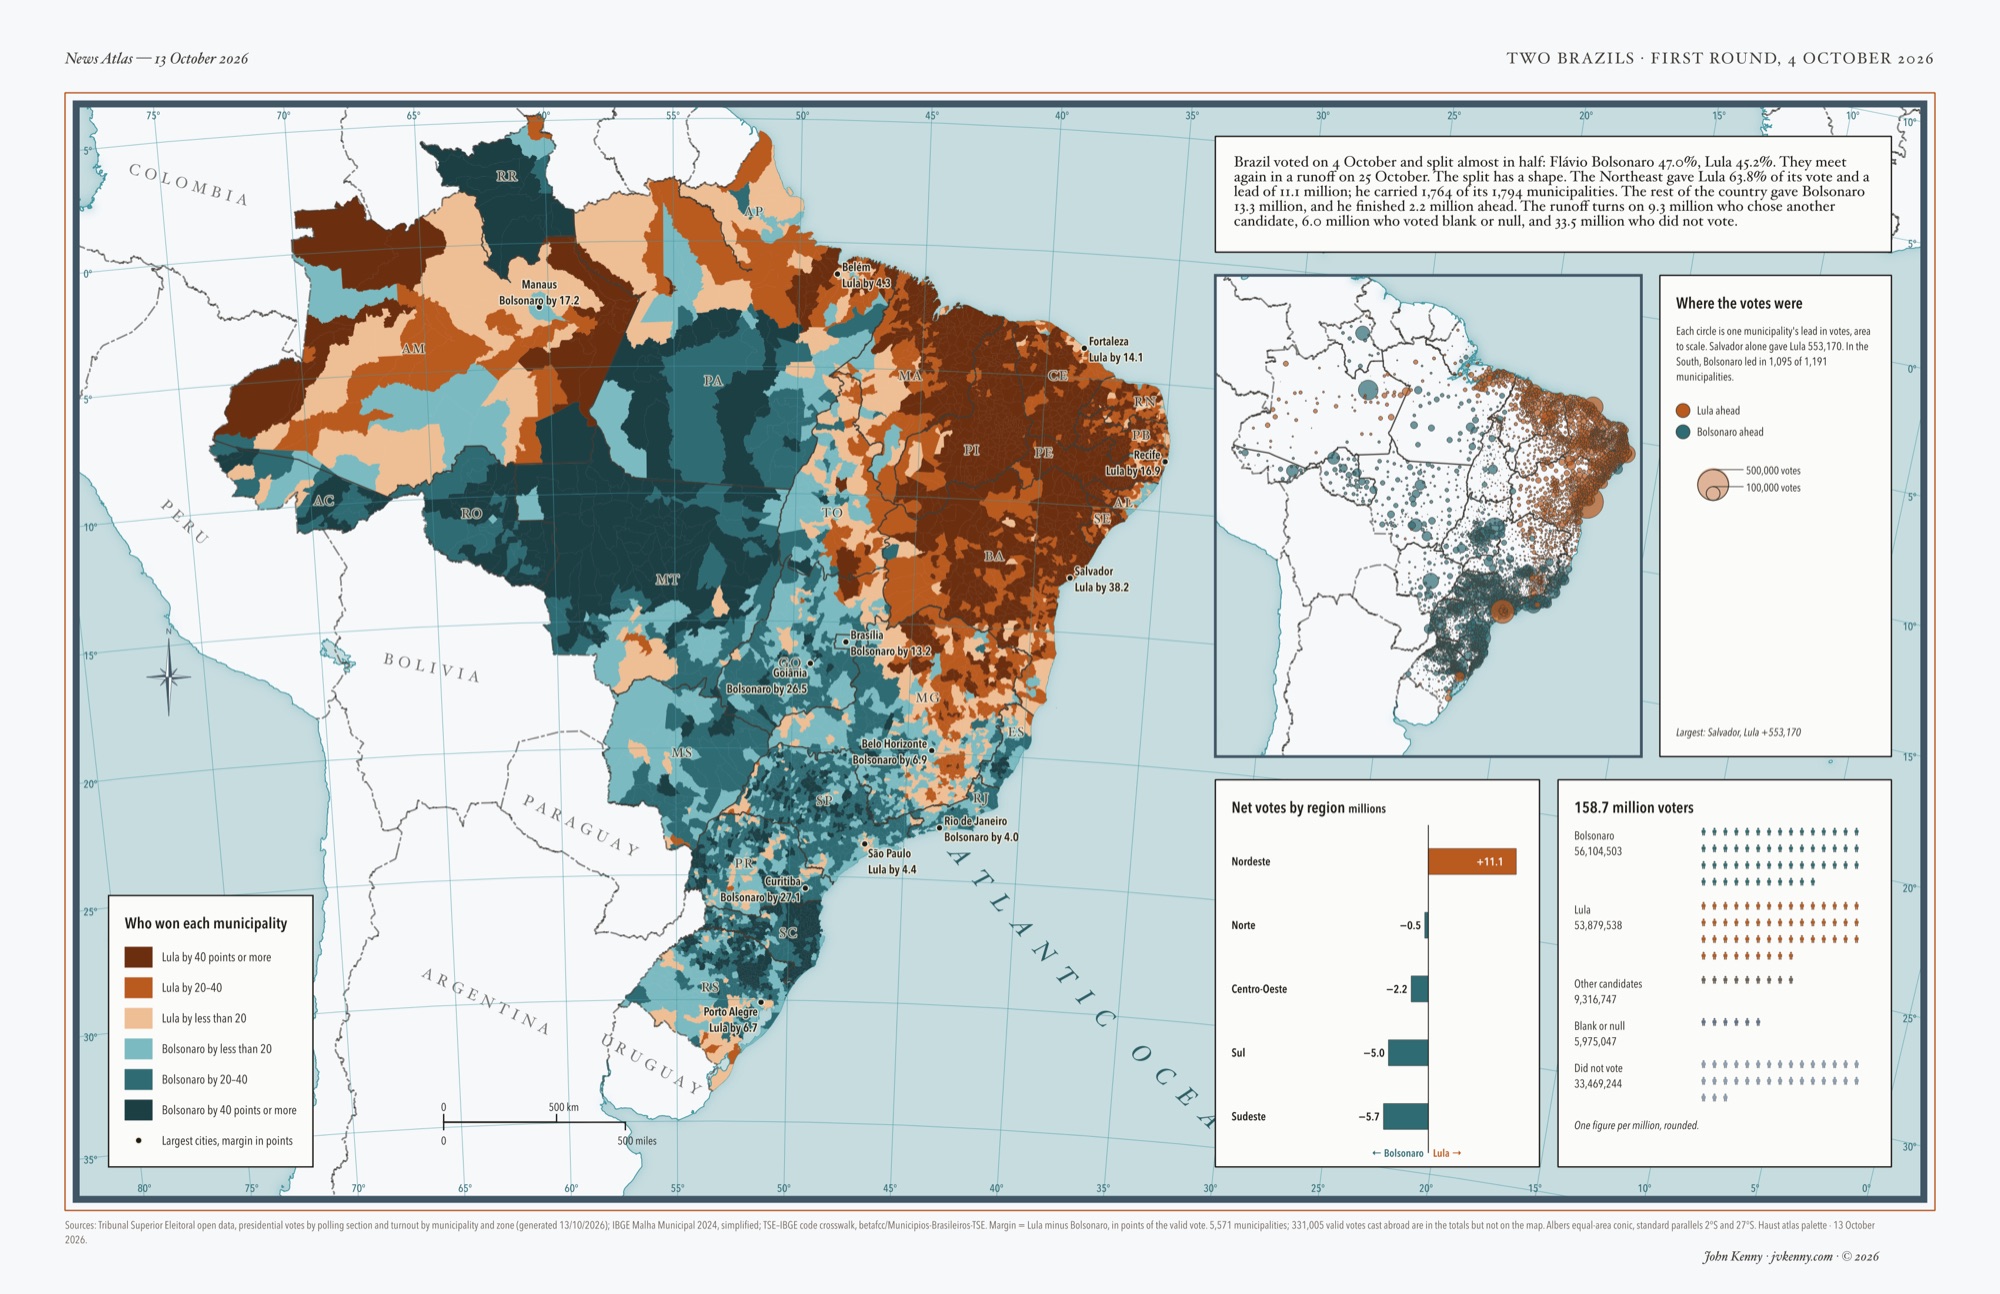
  2. Map of Brazil's 5,571 municipalities coloured by the 4 October 2026 presidential first round: rust for Lula, teal for Bolsonaro, darker for bigger margins. The Northeast is almost solid rust; the South, São Paulo state and the Centre-West are teal. An inset sizes each municipality's lead in votes as a circle, a bar chart gives net votes by region, and a grid of figures shows all 158.7 million voters.

    Two Brazils

    Live map

    News Atlas · Brazil · Oct 2026 · 11 × 17 in

    Brazil's presidential first round, 4 October 2026, by municipality, from the electoral court's polling-station results. The Northeast gave Lula an 11.1-million-vote lead; the rest of the country gave Bolsonaro 13.3 million. An inset counts votes instead of land.

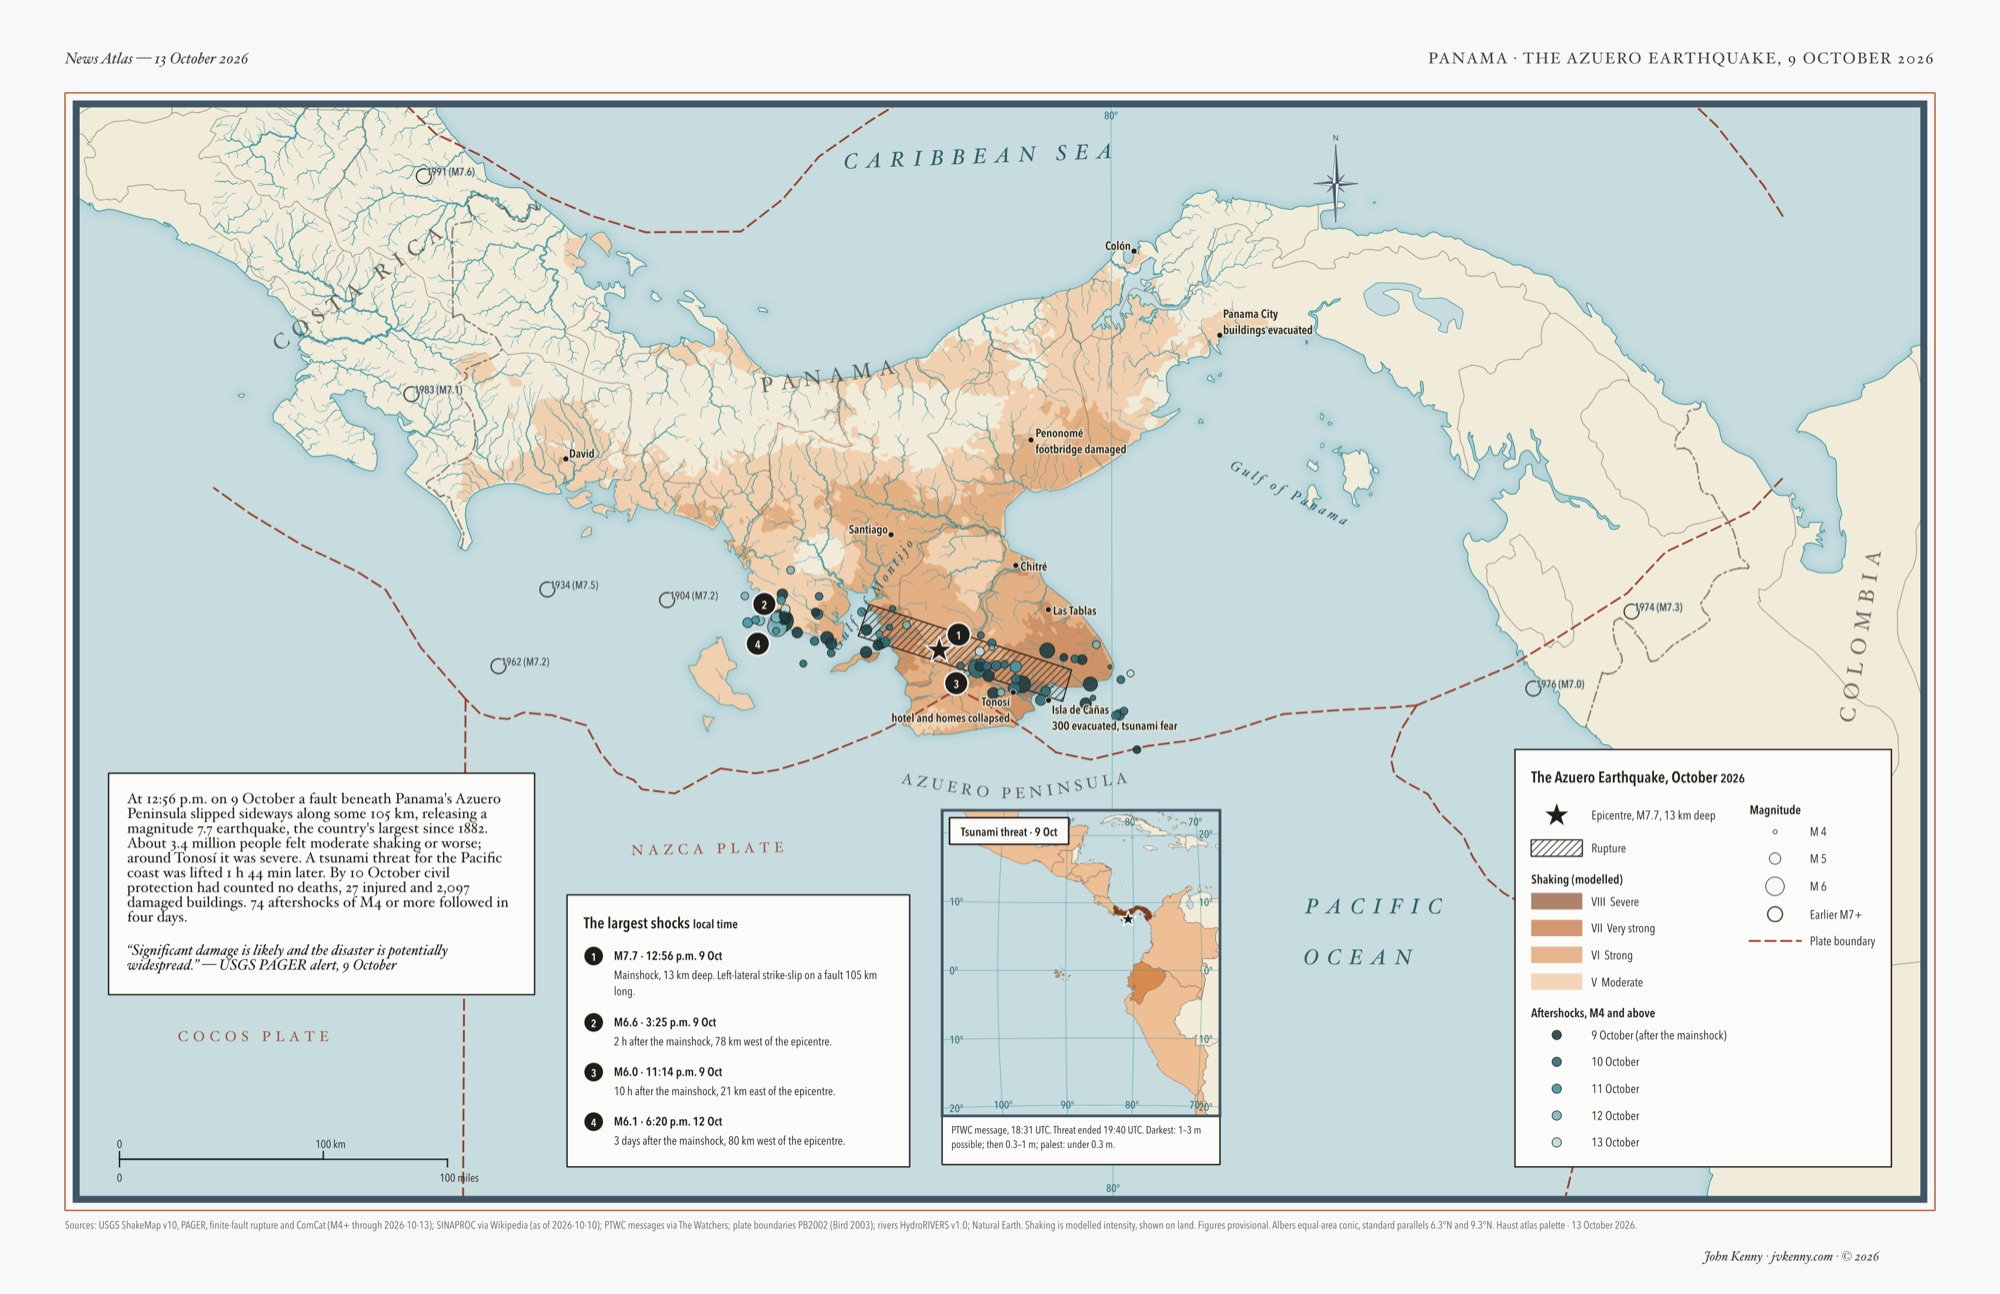
  3. Map of central Panama after the magnitude 7.7 Azuero earthquake: orange shaking intensity over the Azuero Peninsula, a hatched fault rupture, teal aftershock circles, numbered notes on the four largest shocks and an inset of the Pacific tsunami warning.

    News Atlas · Panama · Oct 2026 · 11 × 17 in

    The Azuero earthquake, Panama, 9 October 2026, mapped four days after the shock. Modelled shaking, a 105 km rupture and every aftershock come from USGS data, with the tsunami warning in an inset.

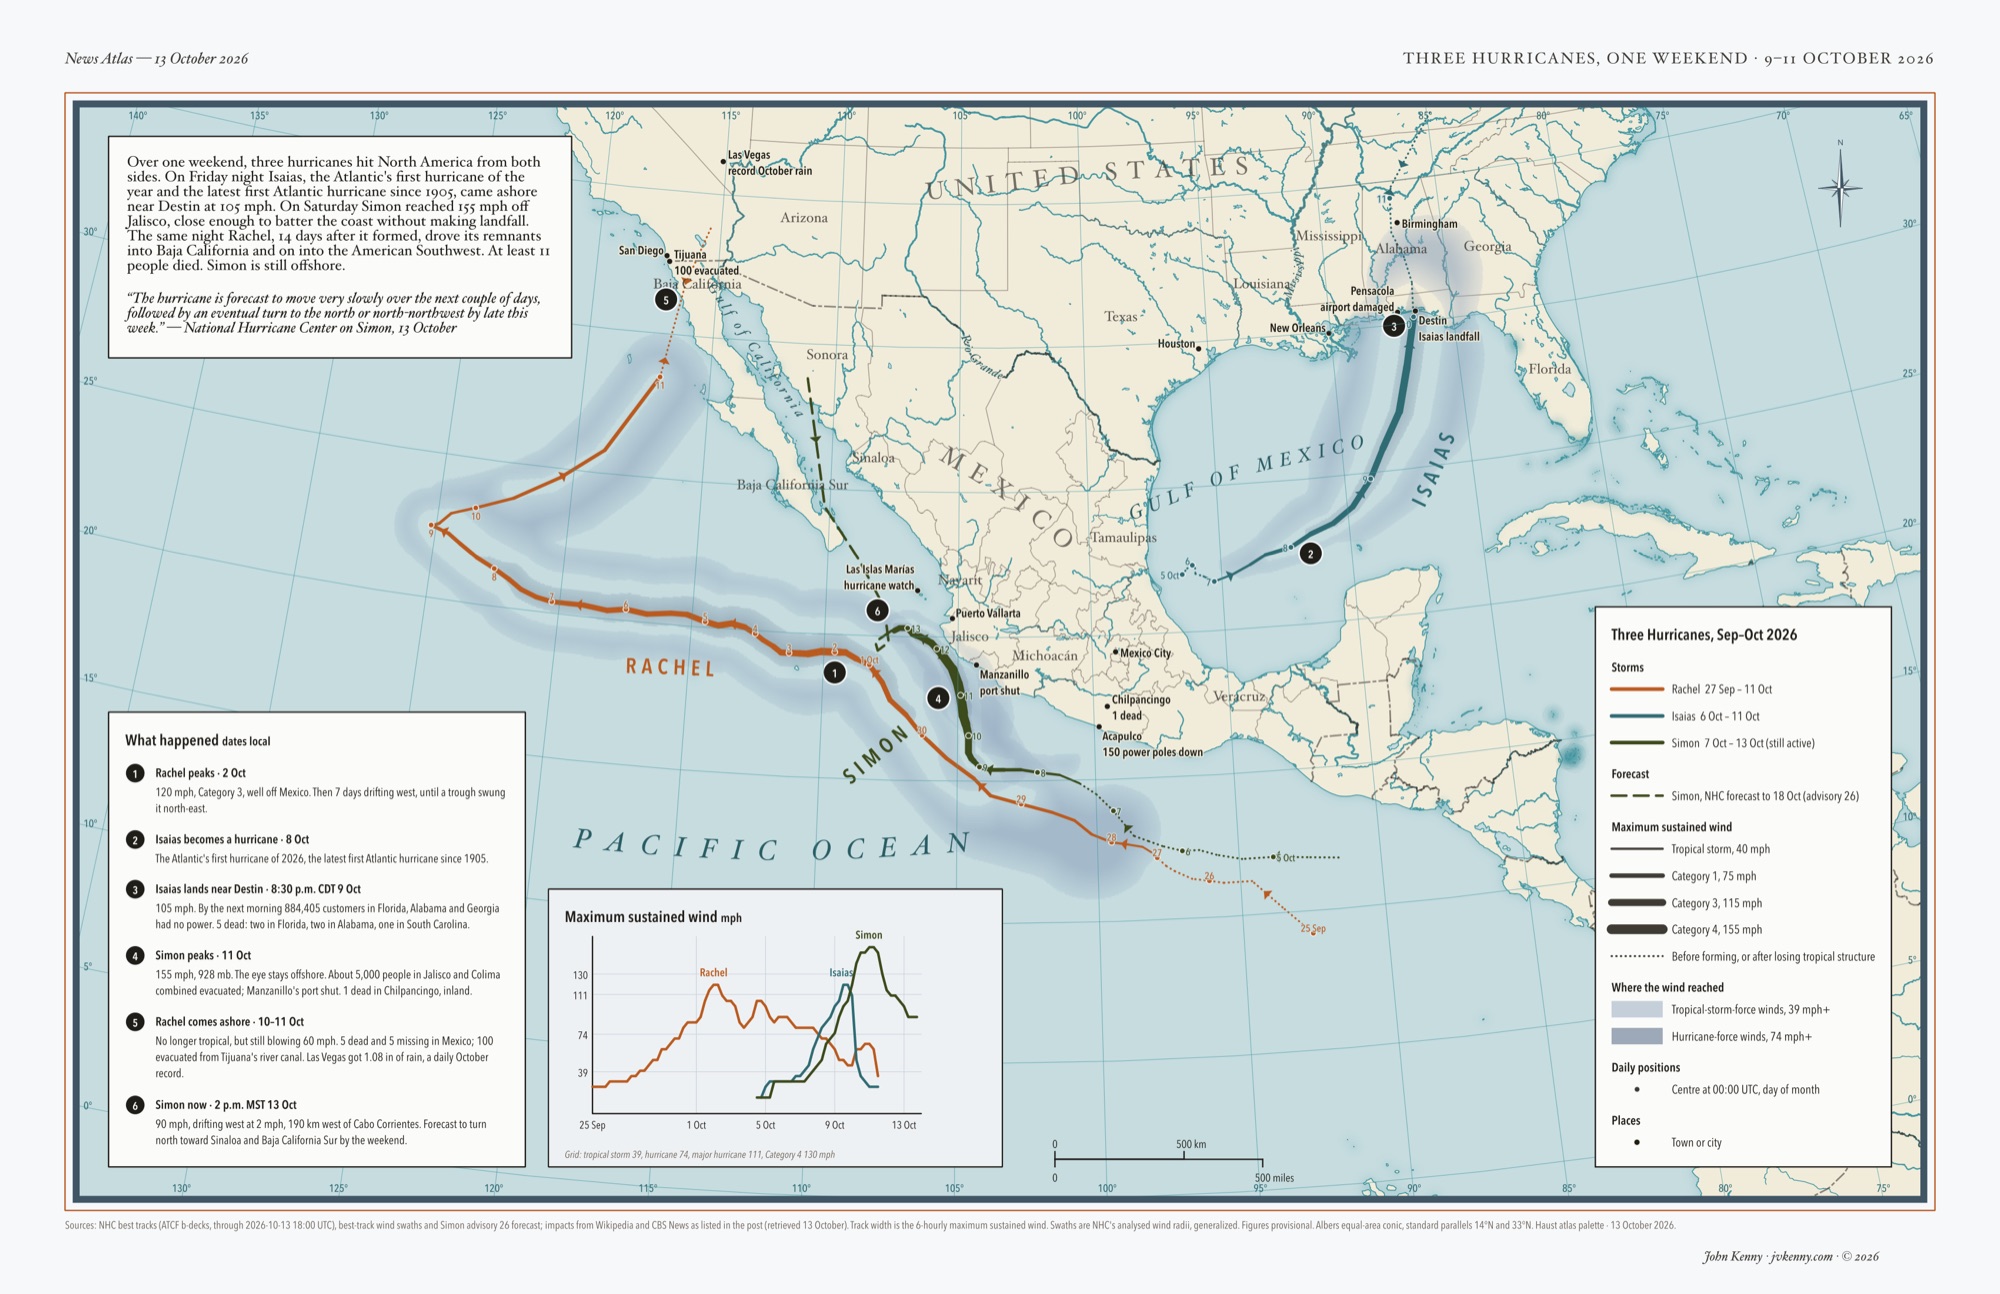
  4. Map of three October 2026 hurricane tracks, Isaias in the Gulf of Mexico and Simon and Rachel in the eastern Pacific, with wind swaths, a wind-speed chart and numbered notes.

    News Atlas · North America · Oct 2026 · 11 × 17 in

    Three hurricanes in two oceans over one weekend, 9–11 October 2026, from National Hurricane Center best tracks. Line width is wind speed; the blue is how far the wind reached.

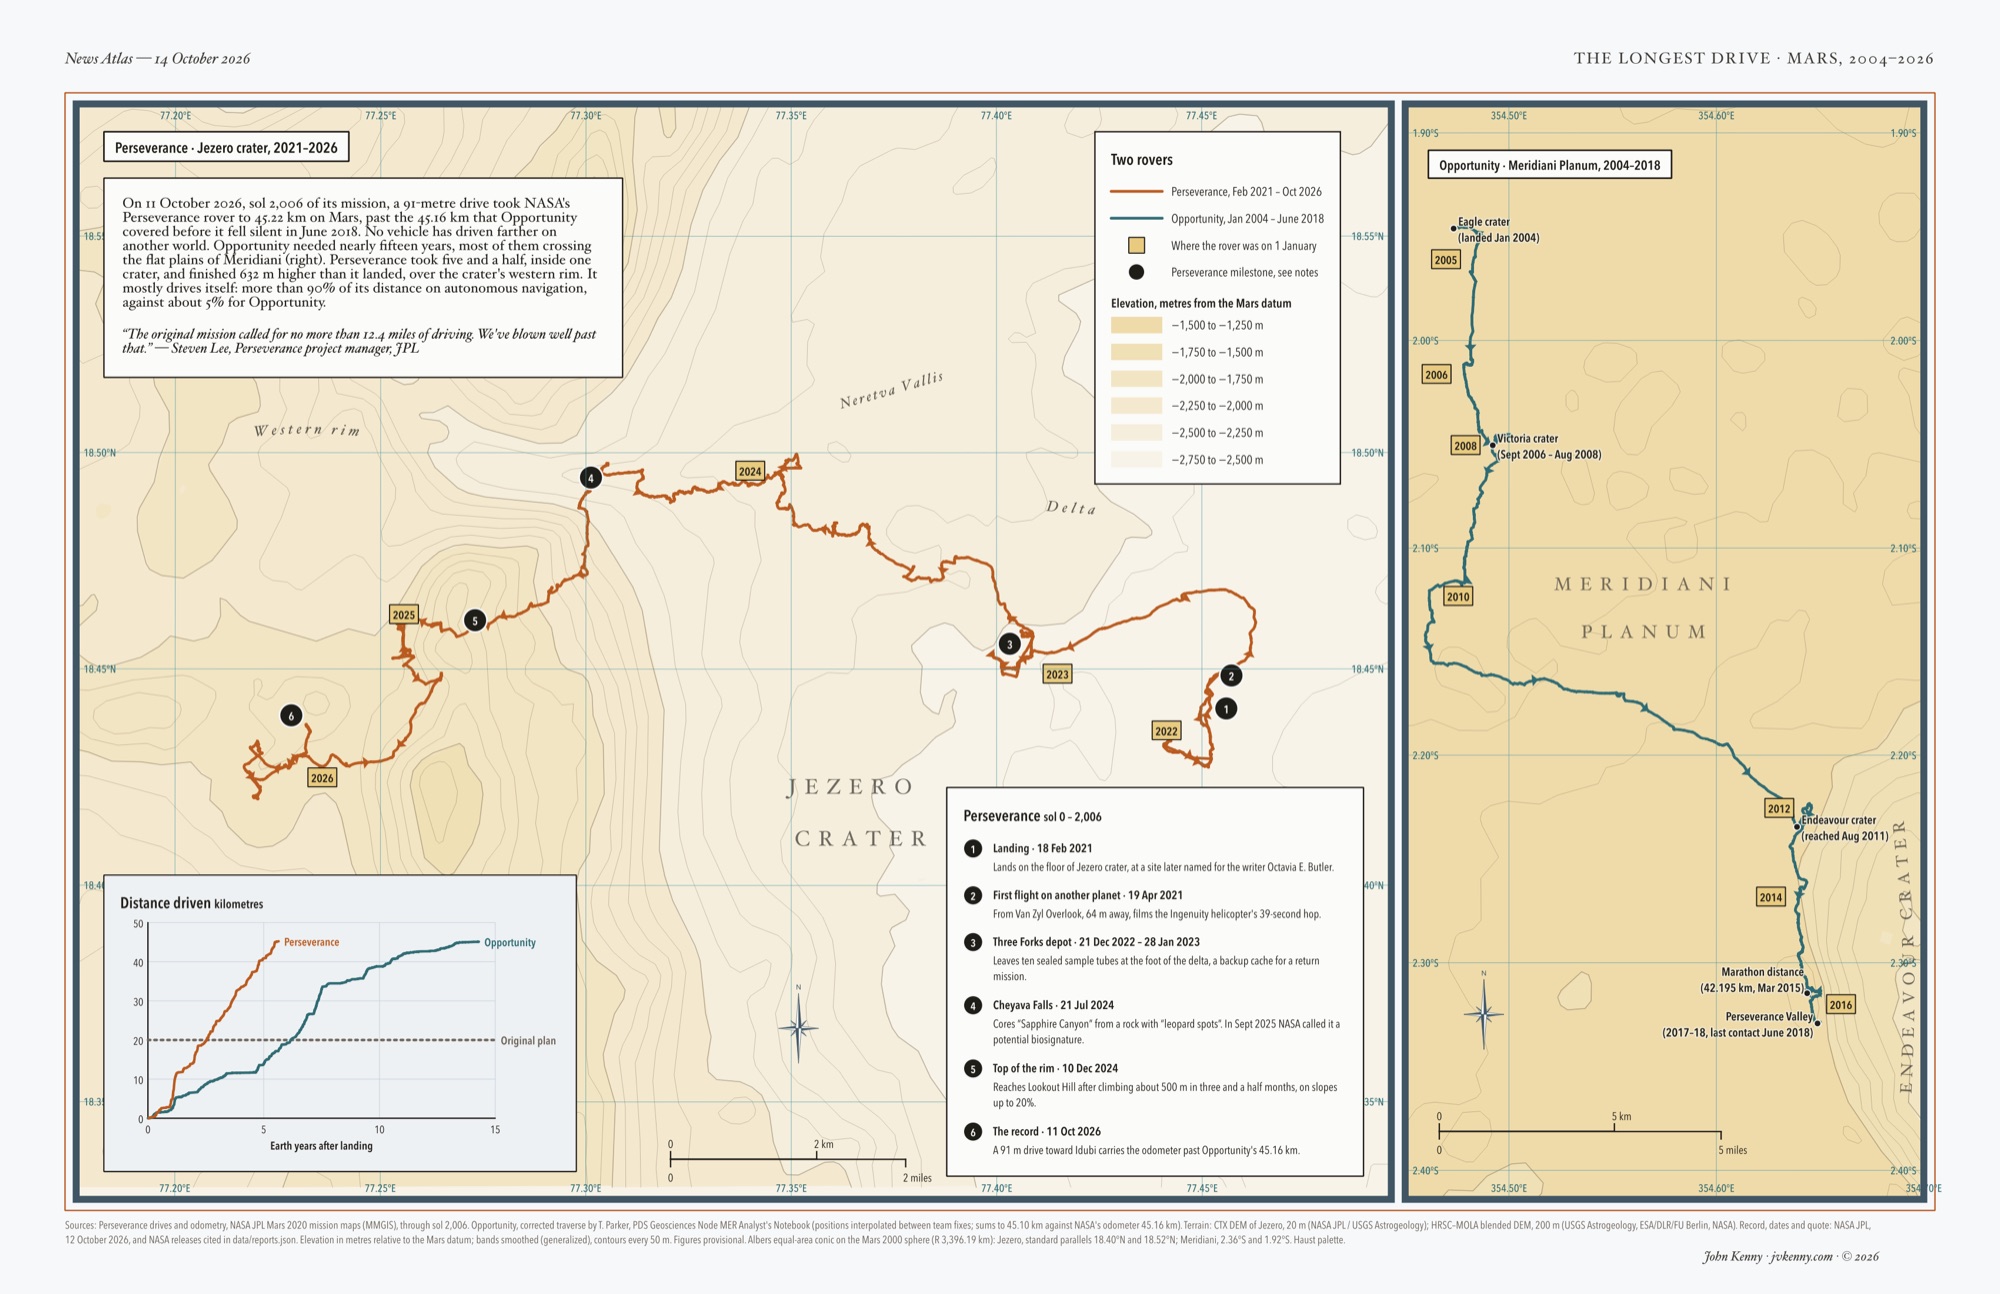
  5. Two maps of rover routes on Mars. The large map shows Jezero crater in pale tan elevation tints with contour lines: Perseverance's orange route winds 45 km from its 2021 landing site on the crater floor, west across the delta near Neretva Vallis and up over the western rim to its October 2026 position, with tags marking where it stood each 1 January and six numbered milestones. A narrow panel at the right shows Opportunity's teal route running south across the flat plains of Meridiani Planum from Eagle crater past Victoria crater to the rim of Endeavour crater, 2004 to 2018. A chart compares the two rovers' distance driven against years since landing: Perseverance's line climbs past 45 km in under six years, Opportunity's takes more than fourteen.

    News Atlas · Mars · Oct 2026 · 11 × 17 in

    The longest drive on another world, Mars, 2004–2026. On 11 October 2026 NASA's Perseverance passed the 45.16 km Opportunity drove across Meridiani Planum, in five and a half years against nearly fifteen. Routes from the rovers' own position data; terrain from orbital elevation models.

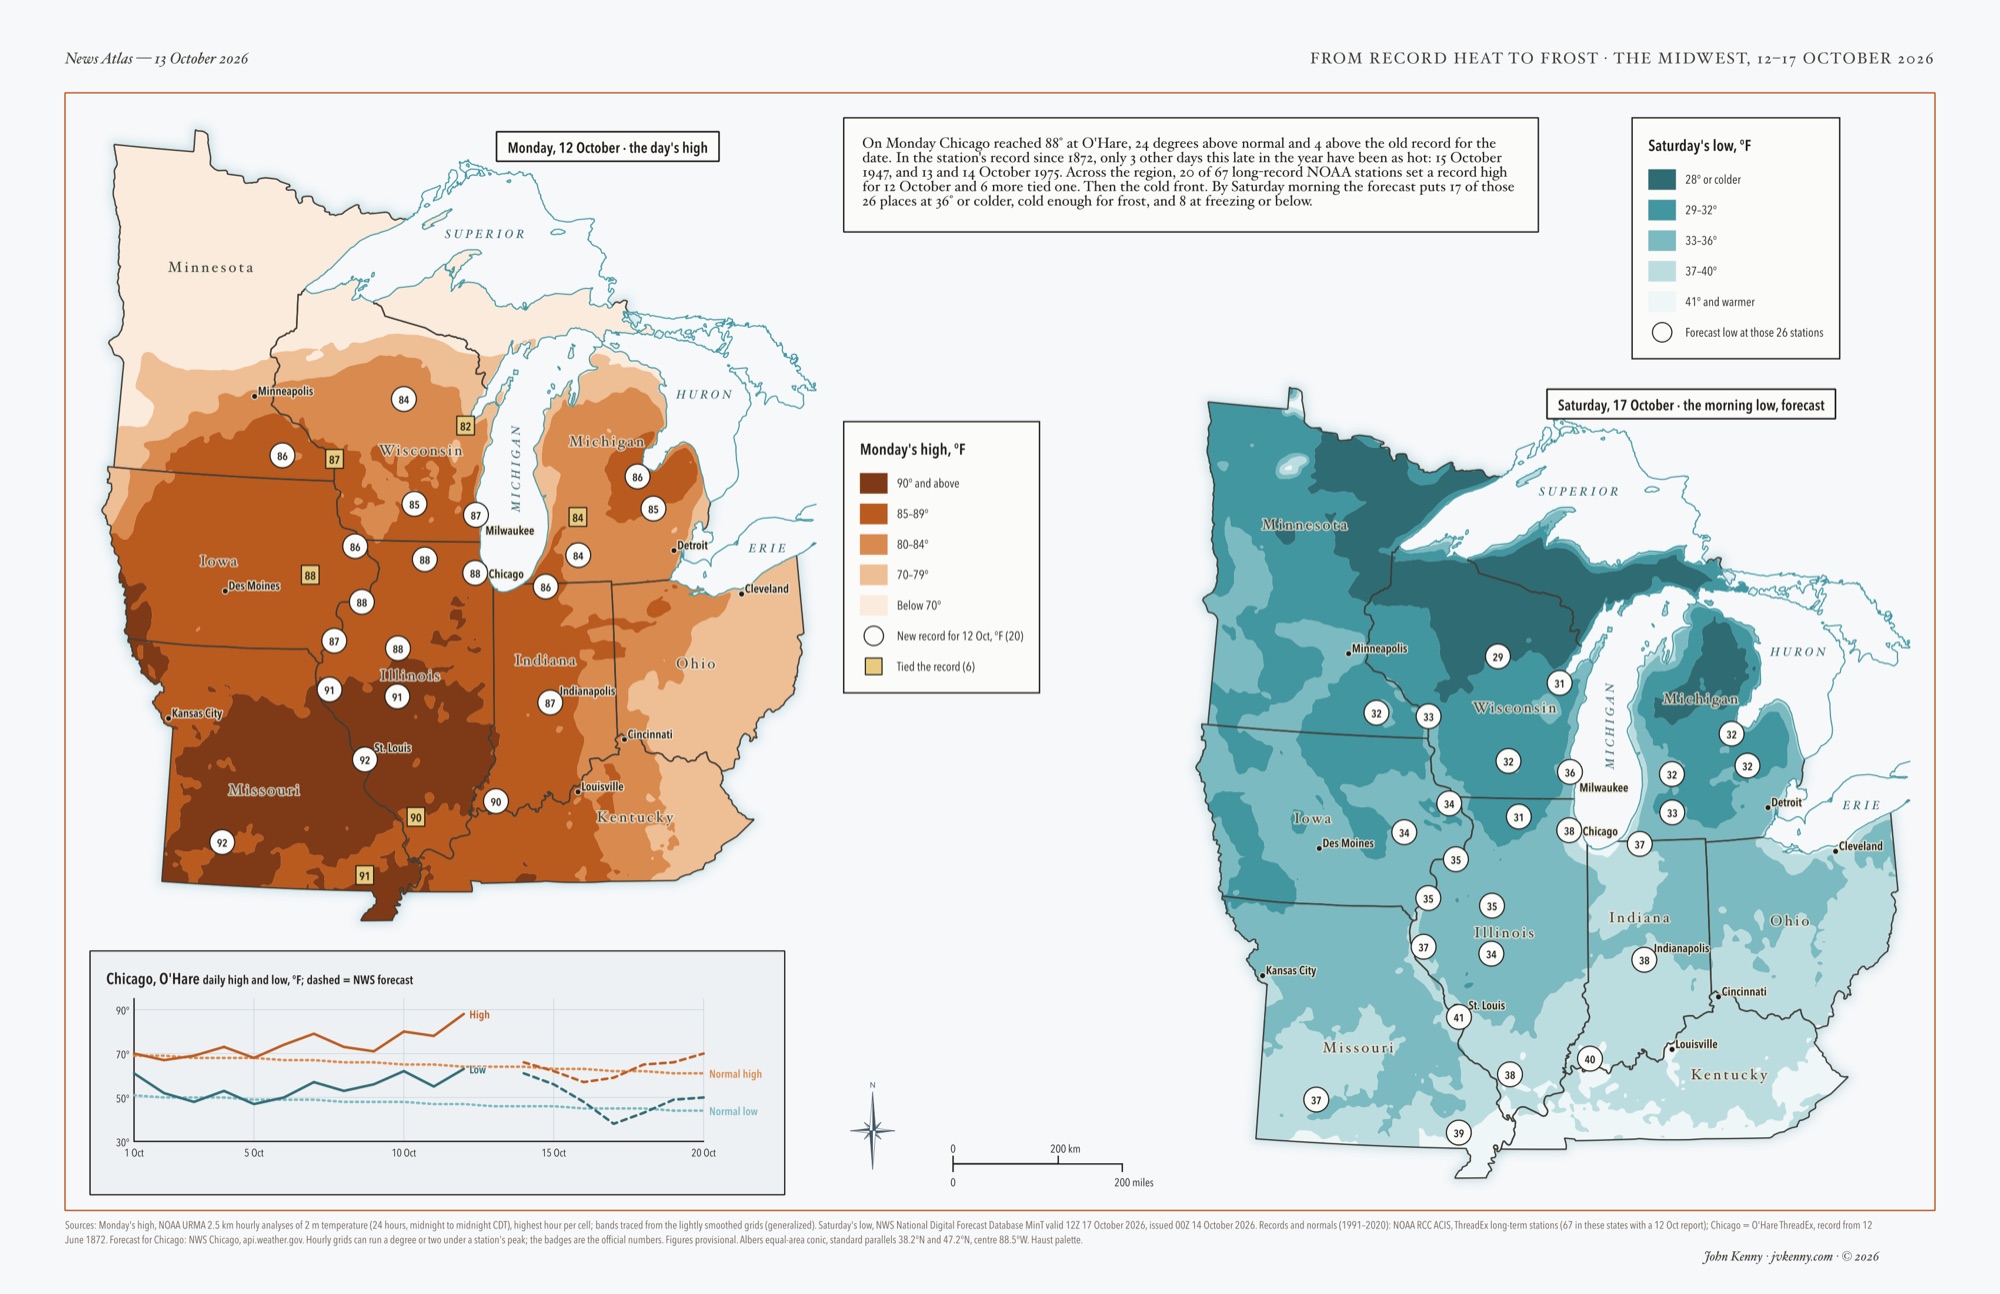
  6. Two maps of the same nine Midwest states side by side. Left, in orange-brown shades, the high temperature on Monday 12 October 2026: 90°F and above across Missouri and southern Illinois, 85–89° across Iowa, Illinois, Indiana and southern Wisconsin, cooler toward northern Minnesota. White circles mark the 20 long-record weather stations that set a record high for the date, tan squares the 6 that tied one. Right, in blues, the forecast low for Saturday morning, 17 October: 28°F or colder across northern Minnesota, northern Wisconsin and Michigan's Upper Peninsula, around freezing across most of Wisconsin and Michigan, upper 30s farther south. The same stations carry their forecast lows. A chart tracks Chicago's daily highs and lows through October against normal.

    News Atlas · Midwest · Oct 2026 · 11 × 17 in

    From record heat to frost, the Midwest, 12–17 October 2026. Monday's highs come from NOAA's hourly temperature analysis, with the 20 stations that set a record for the date; Chicago reached 88°F. Saturday's lows are the National Weather Service forecast, to be updated with observed lows after the weekend.

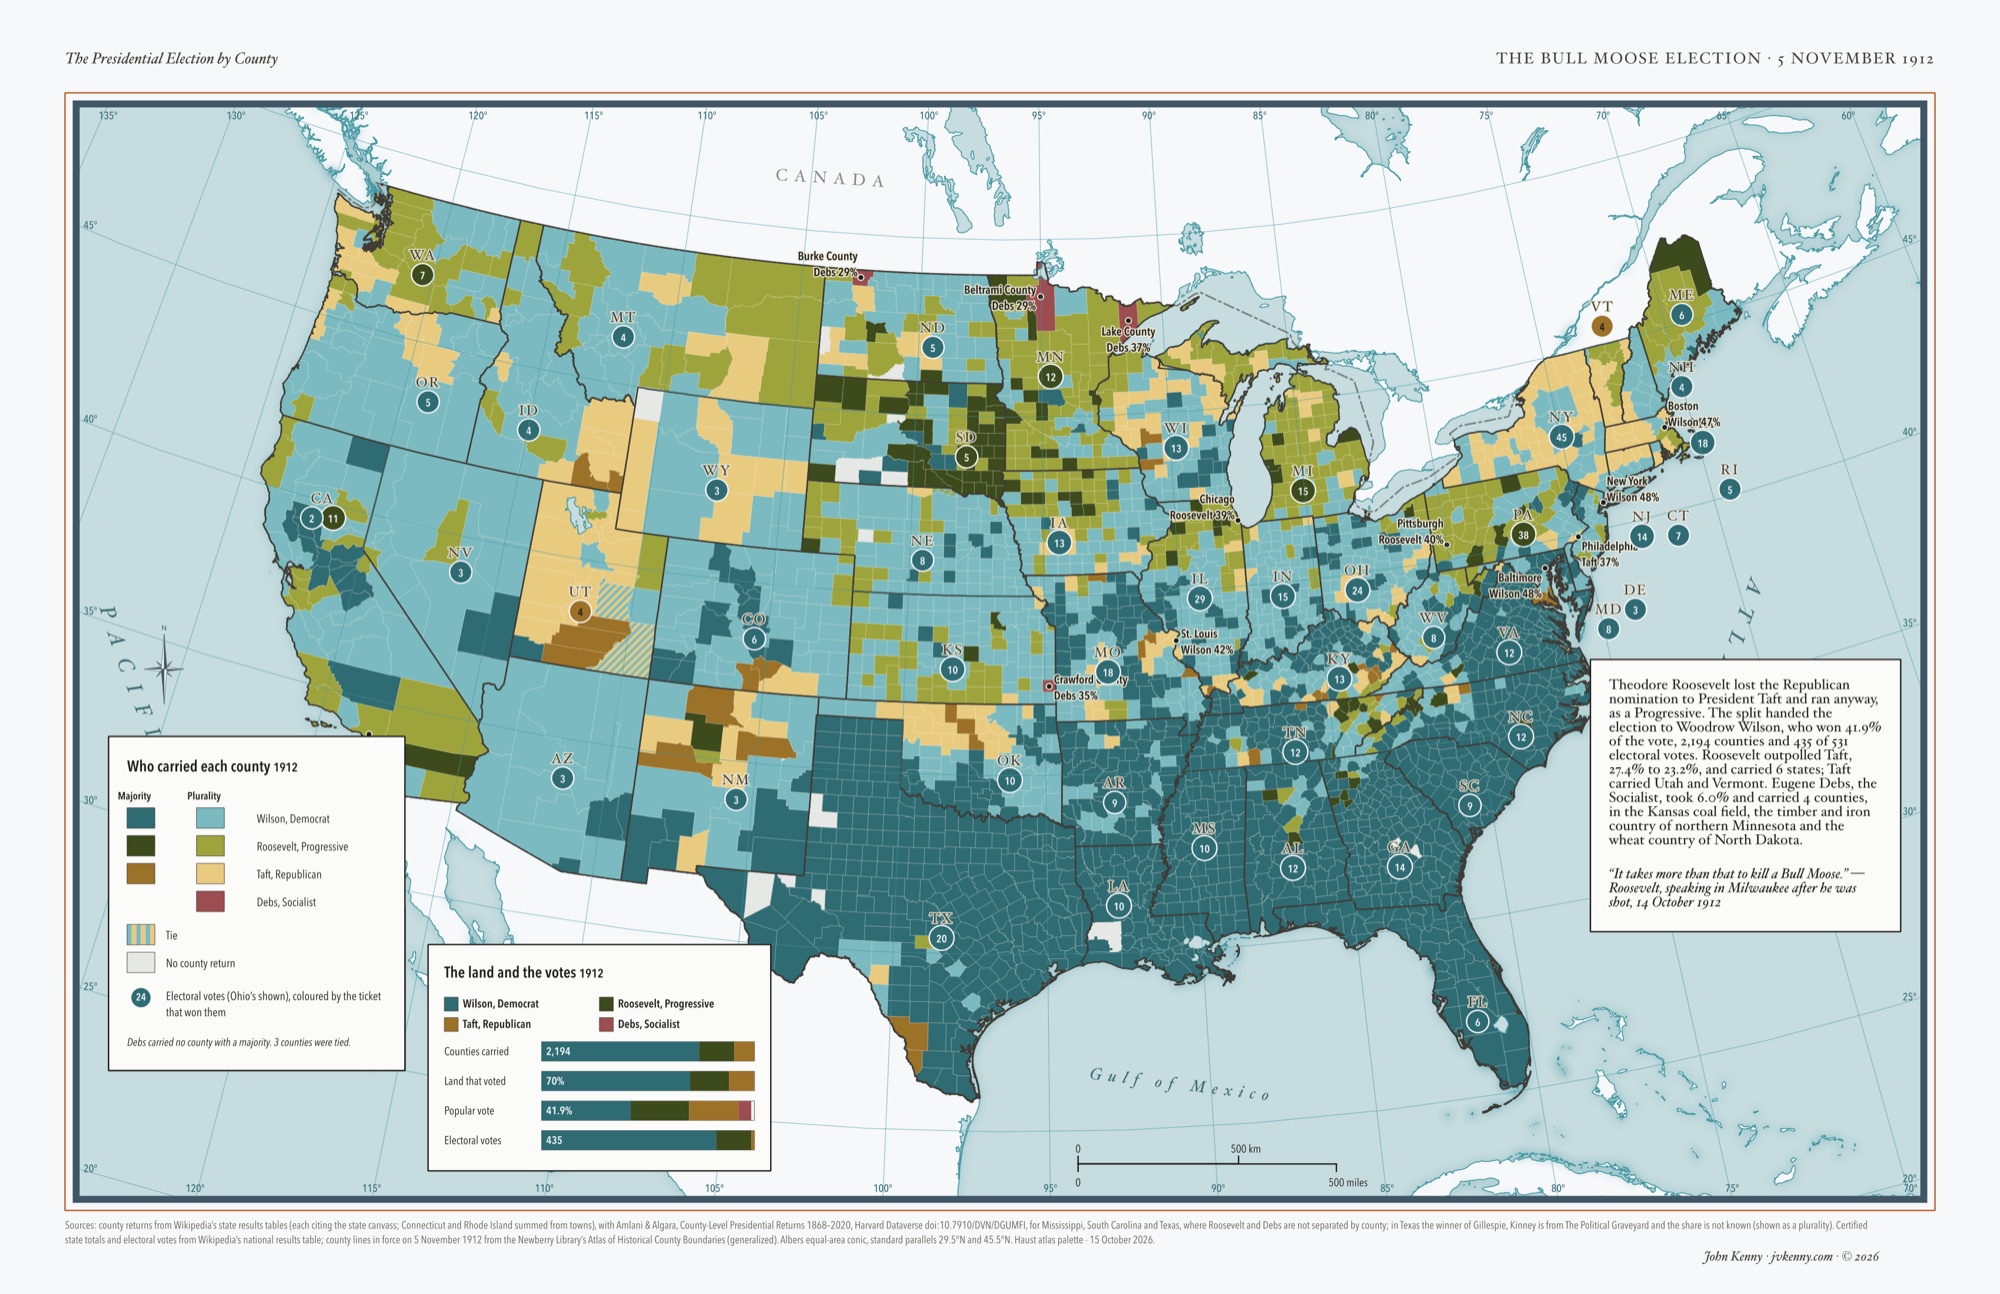
  7. Map of the contiguous United States in 1912 with every county coloured by the candidate who carried it, dark for a majority and light for a plurality. Wilson's teal covers the South almost solidly and much of the Midwest and West in a lighter shade. Roosevelt's green runs across Minnesota, the Dakotas, Michigan, Pennsylvania, Washington and California, darkest in eastern South Dakota. Taft's gold holds Utah, Vermont and scattered counties in New York, Pennsylvania and the Mountain West. Four red counties mark where Debs won: Crawford in Kansas, Beltrami and Lake in Minnesota and Burke in North Dakota. Badges give each state's electoral votes in the winner's colour, and a chart compares each candidate's share of counties, land, popular vote and electoral votes.

    History · United States · 1912 · 11 × 17 in

    The Bull Moose election, 5 November 1912, by county, on the county lines of election day. Roosevelt split the Republicans and Wilson won with 41.9% of the vote, 2,194 counties and 435 of 531 electoral votes. Debs, the Socialist, carried four counties. County returns from the state canvasses.

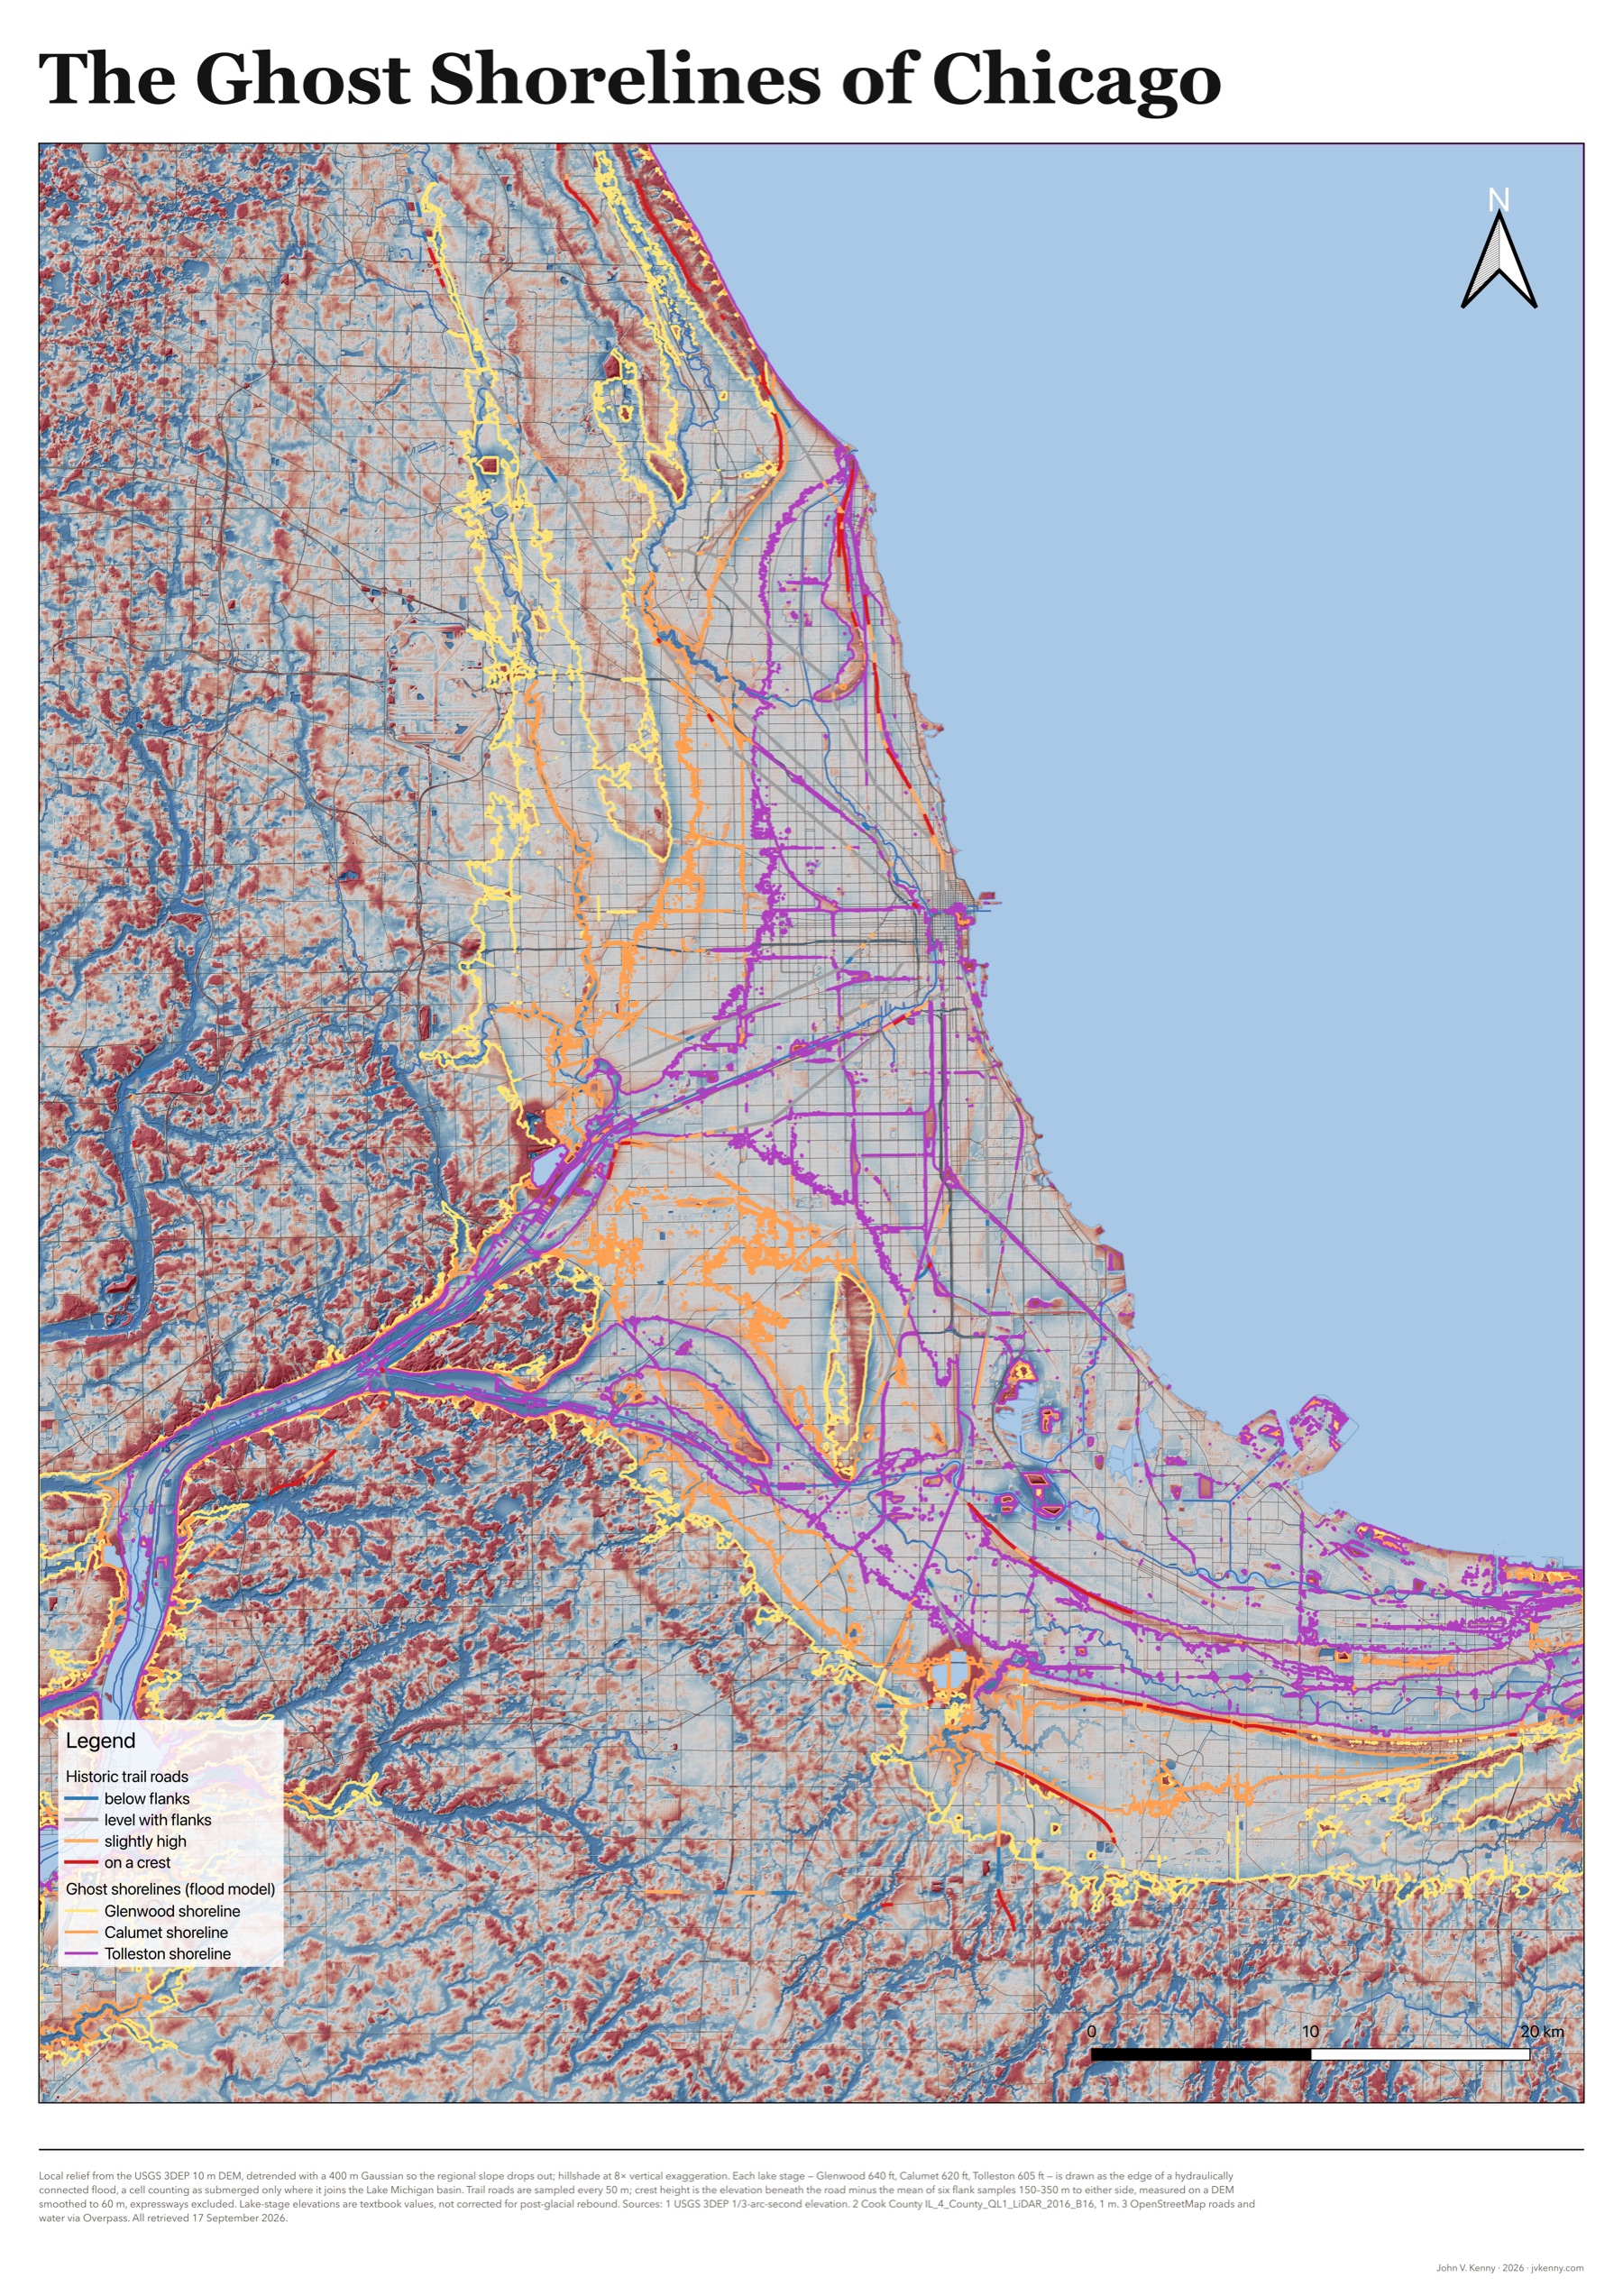
  8. Poster map of the Chicago region: local relief from lidar in red and blue, the shorelines of glacial Lake Chicago, and historic trail roads colored by how far they stand above their flanks.

    Study · Chicago · Lidar study · A2 poster

    The Ghost Shorelines of Chicago. A lidar test of whether the city's diagonal streets ride the beach ridges of a glacial lake, printed at A2. Half of them do.